
Get Started
The purpose of this website is to support anybody who wants to use empirical methods to explore personal questions. We call this practice “personal science.” Here is a summary of our most useful advice about self-tracking, with a special focus on making it easy to get started. We’ve organized this advice around the four stages of the Personal Science Cycle: Questioning, Observing, Reasoning, and Explaining.
Questioning
The process of articulating your reasons is far more important than what gadget to buy. When you articulate your reasons, you clarify the criteria for choosing what to track and what tools to use. You also gain access to others in the QS community who may be able to help, because they share your interests.
Here is a list of some common motives for starting a self-tracking project, just to get you thinking. Do any of these express your goals?
- Increasing awareness of when or where something is happening so you can be more in control
- Learning about the frequency and intensity of a symptom such as pain, dizziness, cramps, or allergies, to support medical treatment
- Developing a skill, such as data visualization, by applying it to something you’re interested in
- Creative expression using your own data
- Tinkering with interesting hardware
- Making progress in training for sports and fitness
- Pacing physical therapy and/or recovery from injury
All of these are good reasons for starting a self-tracking project, and there are countless others. One under-appreciated motivation is that tracking is just a way to think more deeply about something going on in your life. People have learned something of value from tracking something as simple as the books they’re reading or the music they’re listening to.
Try writing a short paragraph expressing your goals and questions. You are welcome to use the “Project Log” section on the QS Forum to post even your earliest ideas and see if others can advise. This is an easy and powerful first step: you’ve now successfully started your self-tracking project. And if it seems odd that a self-tracking project, which often involves quantitative measurement, should begin with typing or handwriting a few sentences in a notebook, keep in mind that the lab notebook has been a core tool of science since laboratories were invented.
Observing
Self-tracking projects involve deliberate observations. We know this may seem trivially obvious. But we mean something specific by “deliberate observation.” That is, that you choose one or more carefully defined elements in your life to keep track of and you isolate these elements from the stream of your experience in order to give them special attention. This involves a decision: What do you want to observe?
Deciding What To Observe
Choosing what to observe often involves some trial and error. Do some thought experiments first. Try to guess what the record of your observations will look like after your project gets going — will there be a pattern? Even a very short planning phase of a quarter of an hour can yield important insights about what precisely you’d like to track, helping you think more clearly about whether the observations are likely to be relevant, accessible, variable, and distinct.
- Relevant: Does knowing more about this really offer insight into what I care about?
- Accessible: Can I collect these observations easily, without special instruments or lab tests?
- Variable: Can I expect it to change over hours, days, or weeks?
- Distinct: Does it stand out clearly enough that I can tell when it happens or how intense it is?
If your project involves biomedical measurements, your exploration of their trustworthiness may be more intense. We’ve offered some guidance for evaluating validity of biomedical devices used for self-tracking in this post: Is My Data Valid? However, when you are just getting started there’s no need to wade into the challenge of doing your own validation of biometric instrumentation. You can learn a lot from tracking something simple.
Here’s an example. Jakob Eg Larsen, a professor of engineering and the co-organizer of QS Copenhagen, suffered from headaches. But after he started his headache tracking project he realized it was difficult to use standard measurement approaches. After some thinking, he decided not to track his headaches, but to note each time he took his pain medicine. This was unambiguous and made his project much easier. (To find out his surprising conclusion watch his short talk: My Headaches from Tracking Headaches.)
Recording Your Observations
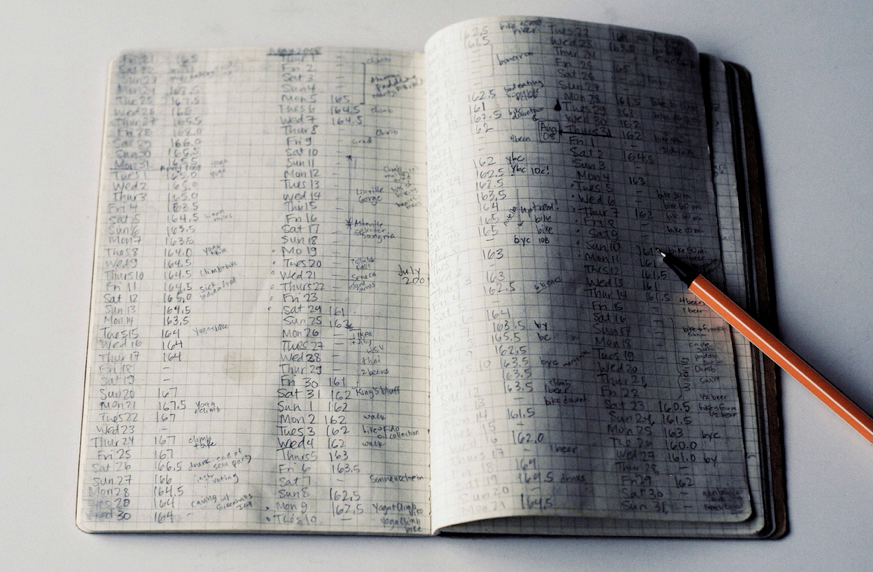
The tool for recording your observations does not need to be digital. Sometimes a smartphone and electronic sensors are useful, but there are times when a pencil and paper will do. We’ve seen many excellent self-tracking projects that involve making just one numerical measurement daily. For instance, you can record your self-assessment in a notebook using a numerical scale. Examples of self-assessments we’ve seen in successful projects include:
- Mood before going to sleep or feeling of restedness upon awakening
- Interference of pain with normal daily functioning
- Subjective sense of “readiness to train” in sports
If your project requires a lot of work every day, you’re more likely to drop it before you learn anything useful. Ask yourself: How’s this process going to feel when my initial enthusiasm dips, or my work or family life requires extra attention? We’ve been privileged to work with self-trackers doing marvelously complex and demanding projects, some involving millions of observations. But among the best projects are the simplest. For inspiration, take a look at the way designer Ellis Bartholomeus collected observations about her state of mind.
Securing Access To Your Observations
Many self-tracking projects involve tools that collect observations passively. For instance, there are wearable gadgets that track activity, sleep, location, blood pressure, body temperature and heart rate. Other projects make use of tests available from a lab or pharmacy: blood glucose, ketones, cholesterol, luteinizing hormone, and many more. When you are getting started on a self-tracking project there is one especially important question you’ll want to ask about your tool: Does it give me access to my own data? Absurd as it may sound, many self-tracking tools only offer summaries of data, or only offer data in a ridiculously inconvenient format.
Here’s health educator Ilyse Magy describing the problem of a good tool with bad access. The question of access is especially important for tools that collect data passively and store it remotely, so test for access at the very beginning: find the export function and check whether the file it sends you is in a tabular format you can open in a spreadsheet. If not, consider whether there is an equivalent tool with better access.
Help With Tools
There are many hundreds of commercial self-tracking tools that could be relevant to your project, along with countless everyday and DIY tools that might work even better. If you are looking for a specific tool, or have questions about a tool you’re currently using, try posting in the QS Forum. We keep an eye on questions posted there and try to get them answered.
Reasoning
Now that you have the record in hand, there are many different ways to interrogate it. If you have a numerical record, you can take advantage of centuries of accumulated knowledge on teasing meaning out of data, making predictions, and increasing your confidence in connecting causes with effects. Getting meaning from data is the ultimate “low floor/high ceiling” task: there are ways to learn that are accessible to everybody, including young children; and there are approaches that may only become rewarding after years of practice. Here are three ways to reason using your observations that can work immediately.
Create a Baseline
A baseline tells you “how things are.” By carefully observing your current situation, you set yourself up for knowing when and how it changes.
Try a one number baseline: A baseline measurement can be as simple as a single number representing a single measurement. How many pushups can you do without resting? That’s your baseline for pushups. You can sometimes use a single number baseline to represent complex phenomena. For instance, the late Seth Roberts, a highly creative experimental psychologist who helped create the culture of the Quantified Self community in its first years, gave himself a simple cognitive test every morning. He paid special attention to his “record score,” a single number that helped spark new ideas about things to test when he saw an unexpected improvement. (Today, you can set up your own quick cognitive tests using the free service by Yoni Donner called “Quantified Mind.”)
Make a baseline from an average: When a measurement jumps around due to normal daily fluctuation (think heart rate, blood pressure, body weight, or mood), take an average of several measurements to get a meaningful baseline. Thinking about how to average naturally pushes you to consider how much variation you expect, and how it might change under different conditions. Is a baseline from morning measurements different from one built in the evening? Measuring several times and calculating the average leads directly to learning.
Collect a “bucket” of informal daily observations: Your method of creating a baseline reflects what you hope to find out, so go back to your question: what are you wondering about? You can use a set of casual observations, even simple notes, as your baseline. Your choice of what to note expresses your sense of which factors may change over time.
In this video segment, you can see how college student Lydia Lutsyshyna uses descriptive notes about her daily activities, such as the names of the friends she saw each day, to anchor a self-tracking project that included an intervention.
Use a Timeline
Perhaps the most common formal tool for reasoning with data is a graph showing change over time. Whether you have just a handful of observations or many millions of them you can usually find a way to line them up in a row according to when they were made. Timelines can present fascinating – and frustrating – technical challenges, especially when dealing with big numbers and diverse observations gathered using different methods.
But a very easy way to make a timeline is to take a sheet of paper, label the bottom with the times of your measurements, and mark each measurement’s value in the column above it. Draw a line connecting the points, like a game of connect-the-dots: there’s your timeline. In the video segment we’ve cued up here, you’ll see a remarkable version of a basic timeline chart, created by Jon Cousins and presented at the London Quantified Self meeting in 2011.
Retrospective Annotation
Look at the record of your observations. Is there a change over time? What are some possible reasons for this change? In many cases, the answer to this question is not obvious. In thinking about your own data, you’ll often want to explore what else was going on during this time.
Some people set out in advance to “track everything.” We have a different suggestion. Sometimes simply using your memory to reflect on what your timeline makes visible will give you ideas about causes and effects. Also, in this age of digital tools, many of the things going on in our lives create a record we can consult after the fact. Most digital photos contain a time stamp, allowing you to go back to the day of a measurement and get hints about what you may have been doing that day. If you use a digital calendar, then you will know what appointments you had. Your email also contains many details that can help you reconstruct your past. It’s often possible to annotate our observations retrospectively by going back and adding contextual descriptions to interesting moments.
Explaining
A self-tracking project is a continuous learning process: every step, from your first questions onward, can turn up something useful. Acting on what you’ve learned — and describing it to others — sends you back through every step, thinking more deeply and trying new techniques to test and illustrate your ideas.
Again and again we’ve seen that sharing the details of a project – something that may look like a final step – is actually a way to learn more. There are many ways and places to share your project. You can write a blog post about it and post the link to Twitter with the #quantifiedself hashtag so others can find it. Or you can write about it in the QS forum.
“What Did You Do? How Did You Do It? What Did You Learn?”
Here are three questions that can help you structure your explanation. These three questions have been the spine of hundreds of excellent Quantified Self Show&Tell talks, but you don’t need to present them in public in order to benefit from using this structure. Remember not to skimp on the “how.” A description of your tools and methods may be more important than the results, containing seeds of new questions and ideas.
Be an honest reporter and resist the urge to generalize
We learn best from honest accounting of experience. Even (and especially) when sharing with an audience of experts, there’s no need to make your results more impressive than they were. Things that don’t quite work can be as revealing as things that do.
Just because you experienced a result doesn’t mean others will. In sharing self-tracking projects, your particular experiences are more valuable than broad conclusions. Our individual reports are valuable and instructive on their own terms, because they show what’s possible.
Value good questions and stay in touch
Finding good questions is important. It’s where this guide began, and it’s where it ends. If your self-tracking project suggests good questions to others, you’ve given them valuable assistance; and if their questions send you back to your own observations, they’ve reciprocated. There is no single right way to begin. You don’t need to impress anybody or get anybody’s approval. But we do hope you’ll share what you learn with us!