Tag: dataviz

BLOG

QS17 Preview: Dashboard of My Life

May 16, 2017

David de Souza is tracking 35 metrics on what he considers the most important areas of his life. His streamlined workflow allows him to record everything from sleep, weight and food intake to productivity, yoga and meditation. At QS17, David will share his dashboard and the correlations he’s drawn between diverse aspects of his behavior.

BLOG

QS17 Preview: My Life as a Comic Strip

May 12, 2017

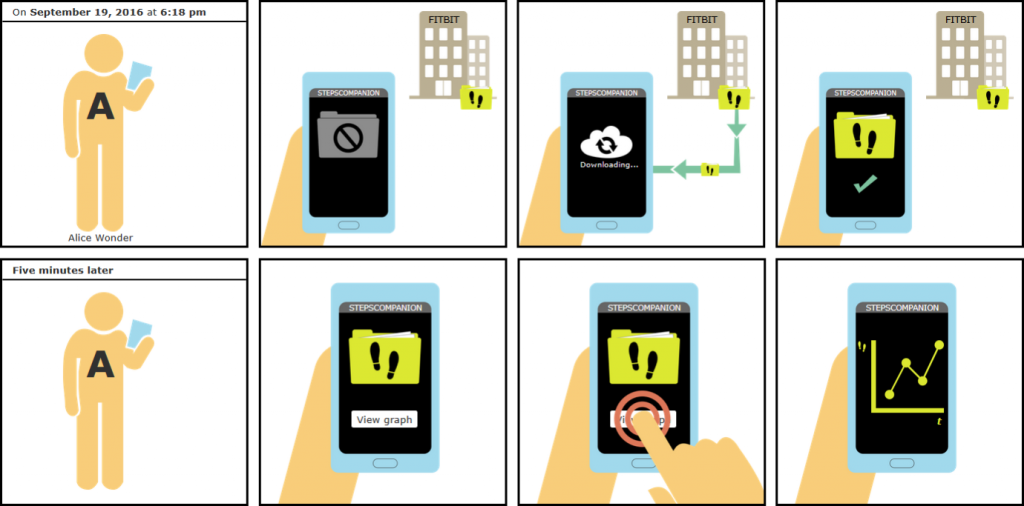
Could a personalized comic strip change the way you see your data? At QS17, Andreas Schreiber, founder of PyData Cologne and the Cologne QS Meetup, will present his Quantified Self comic strips, a technique for making self-tracking easier and more fun.

BLOG

2015 QS Visualization Gallery: Part 2

July 17, 2015

We’re back again with another round of visualizations from our QS15 Conference and Expo attendees. In today’s batch you’ll see a variety of representations of different tracking projects, from tracking biometrics while watching a movie to running distance over nearly 13 years. Enjoy! Name: Bob Troia Description: I tracked my heart rate, HRV, and galvanic…