2015 QS Visualization Gallery: Part 2
Ernesto Ramirez
July 17, 2015
We’re back again with another round of visualizations from our QS15 Conference and Expo attendees. In today’s batch you’ll see a variety of representations of different tracking projects, from tracking biometrics while watching a movie to running distance over nearly 13 years. Enjoy!
 Name: Bob Troia
Description: I tracked my heart rate, HRV, and galvanic skin response while watching the movie Interstellar (in IMAX!), then plotted the data to understand how my body reacted during the 3+ hour movie. (Check Bob’s blog post about this data here!)
Tools: Polar H7 chest strap, SweeBeat Life app (iPhone), Basis B1 band, Excel.
 Name: Tahl Milburn
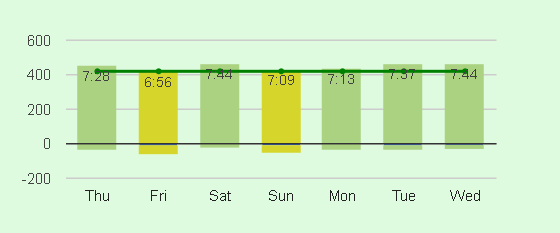
Description: This shows sleep over a week. The overall height of the bar is the time in bed. The part above the baseline is actual sleep whereas the part below 0 is restless sleep or awakening during the night. The line above the bars is the goal number of hours. The bar itself is green is all okay, turns yellow if overall duration is short or awakened too much. Red is even worse.
Tools: Google Charts with data from Fitbit.
 Name: Tahl Milburn
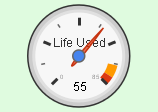
Description: This is a very simple but powerful chart. T his is a “Life Gauge” which show how much of my statistical life has already been used. The ultimate age is based on the consensus estimate from several sources. Note the yellow and red markings indicating that one might be running out of life soon.
Tools: Google Charts for the graph itself. Several sources for computing the ultimate age.
 Name: Julie Price
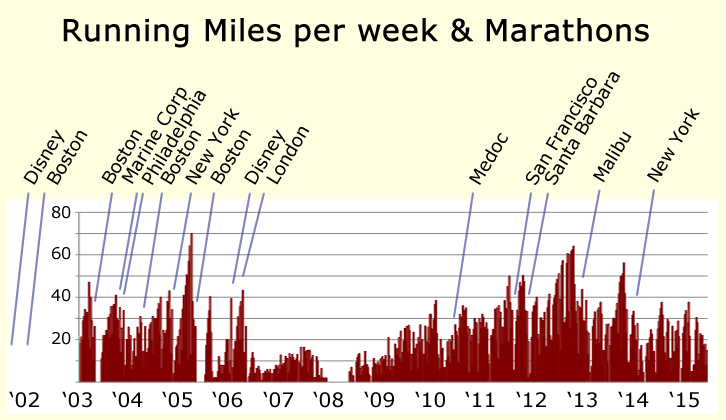
Description: My running miles per week plus marathons since 2002.
Tools: Tracked running miles using various methods and recorded both on paper and, in the past few years, on a Google sheet. Summarized & graphed in Excel before manually adding in marathons.
 Name: Allan Caeg
Description: “How much did you win today?” is one of the most important questions I ask myself every day. This pre-sleep question constantly gets me to reflect on what I did with my free will, inspiring me to ensure that I’d make the most out of every day.
Tools: Reporter
Stay tuned here for more QS Gallery visualizations in the coming weeks. If you’ve learned something that you are willing to share from seeing your own data in a chart or a graph, please send it along. We’d love to see more!

