Numbers from Around the Web: Round 4
Ernesto Ramirez
March 1, 2012
Karsten W. is on an amazing journey towards understanding his personal finances. Thankfully for us he’s been writing about his methods and what he’s learned along the way over at his blog: FactBased. Let’s dive in!
Step 1. Track
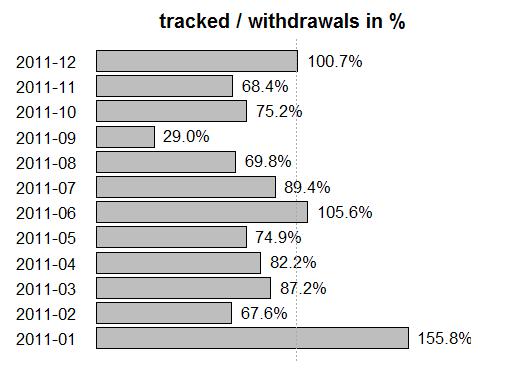
Karsten decided to use twitter to track his expenses and supplement that data with his normal bank statements. Not simply satisfied with this seemingly simple step, he went a bit further and compared his twitter entries to the data from his bank to see how well he was able to self-track:
Step 2: Classify
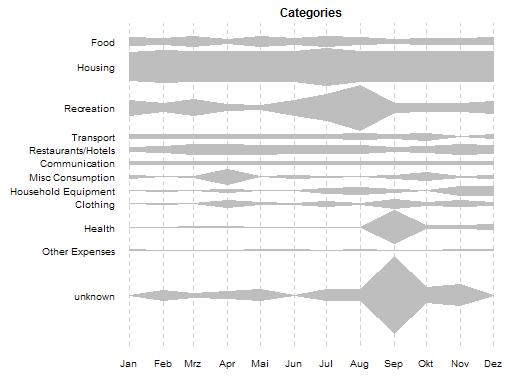
Having compiled his full year of monetary tracking, Karsten then looked to how to better understand where his money was going by classifying his spending. He looked into classification schemes and settled on using the United Nations Classification of Individual Consumption According to Purpose. Why?
It is made by people who have thought more about consumption classification than I ever will.
Again, he did some amazing number crunching and visualized his entire year.
Step 3. Compare
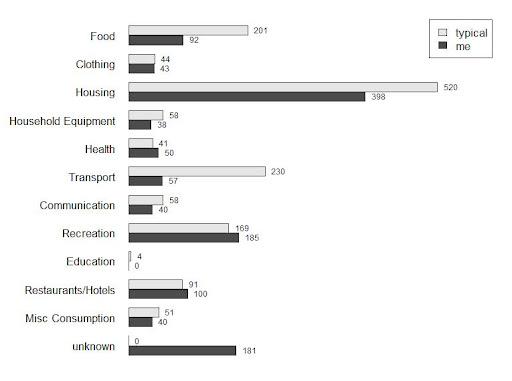
So Kartsen has his expenditure data and he has it classified according to a simple schema. What’s next? Why not compare it to what is typical for someone like him! Karsten did some digging and found the German Federal Statistics office completes surveys of consumption and income every five years. He pulled the data that most closely reflected his income level and created a neat comparison:
I found this series of blog posts to be fascinating. For one, Karsten wasn’t just satisfied with tracking his finances for a full year. He went above and beyond and did some personal data analysis using some really neat tools and methods. I highly suggest you read his posts on tracking, classification, and comparison. Not only are the posts interesting, they also include short “how-to” write ups if you want to implement his analytical and visualization methods using R (an free statistical program). Keep up the great work Karsten!
Every few weeks be on the lookout for new posts profiling interesting individuals and their data. If you have an interesting story or link to share leave a comment or contact the author here.


