2015 QS Visualization Gallery: Part 1
Ernesto Ramirez
July 9, 2015
In 2013, just prior to our our Quantified Self Global Conference, we asked conference attendees to send us examples of their own personal data visualizations that they found especially meaningful. We were blown away by what everyone shared with us. From visualizations of blood glucose readings to GPS traces and plots of time tracking and productivity, the range of visualizations was astounding (you can view some of those visualization by searching the blog for the QS Gallery tag).
This year, we sent out the request once again to attendees of our QS15 Conference and Expo. Once again, our inbox immediately started to fill up with images, graphs, and visualizations describing the tracking experiences of our amazing community. Today, we’re excited to start sharing those visualizations with you here.
 Name: Beau Gunderson
Description: A homemade polysomnogram with a Zephyr Bioharness as the only data
source.
Tools: IPython, matplotlib, pandas, seaborn, numpy.
 Name: Shannon Conners
Description: This graph shows what initially looks like an interesting trend in my activity data. I seem to be less active during the summer months, but when I pair my activity and wear time for the BodyMedia FIT armband I used to generate the data, the real reason for the drop becomes clear. I’m wearing the armband less in the summer months to avoid upper arm strap tan! I know my own device usage patterns, so when I graphed the two measures together, it was immediately clear to me what was going on. To me, this is a simple example that illustrates one of the big challenges of looking at activity monitor data in the absence of data about device usage. Usage patterns can and do change over time and the reasons for these changes may not be as obvious as the change of the seasons. For example, something as simple as breaking the clip-on case you use to carry the phone that counts your steps could greatly impact how often you carry it, and therefore the quality of the data you collect. Some monitors don’t even record a usage metric with which to compare activity data. I like this graph as a reminder that interesting patterns may in fact be data collection or data quality issues in disguise.
Tools: BodyMedia FIT Core BW, JMP
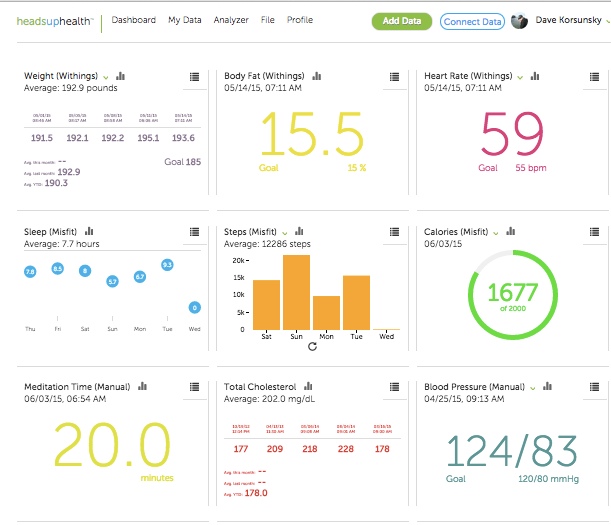 Name:: David Korsunsky
Description: Mashing data from my favorite wearables, my medical records as well as data I track manually into a custom dashboard.
Tools: Heads Up Health is software that can enable anyone to create their own custom configurations.
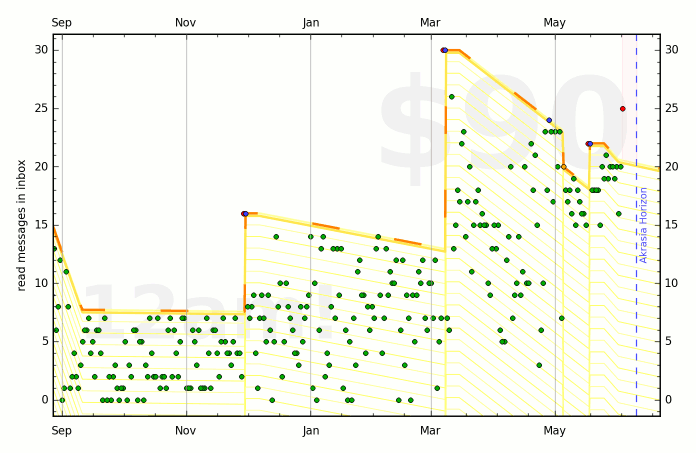 Name:: Daniel Reeves
Description: Number of (read) messages in my inbox over time.
Tools: Beeminder’s GmailZero.com

Description: Trend analysis of my HRV over a 2.5 year period. Displays a stunning seasonal trend.
Tools: iPhone running SweetBeatLife app to measure clinical grade HRV on a daily basis.
Stay tuned here for more QS Gallery visualizations in the coming weeks. If you’ve learned something that you are willing to share from seeing your own data in a chart or a graph, please send it along. We’d love to see more!

