2015 QS Visualization Gallery: Part 3
Ernesto Ramirez
July 28, 2015
We’re excited to share another round of personal data visualizations from our QS community. Below you’ll find another five visualizations of different types of personal data. Make sure to check out Part 1 and Part 2 as well!
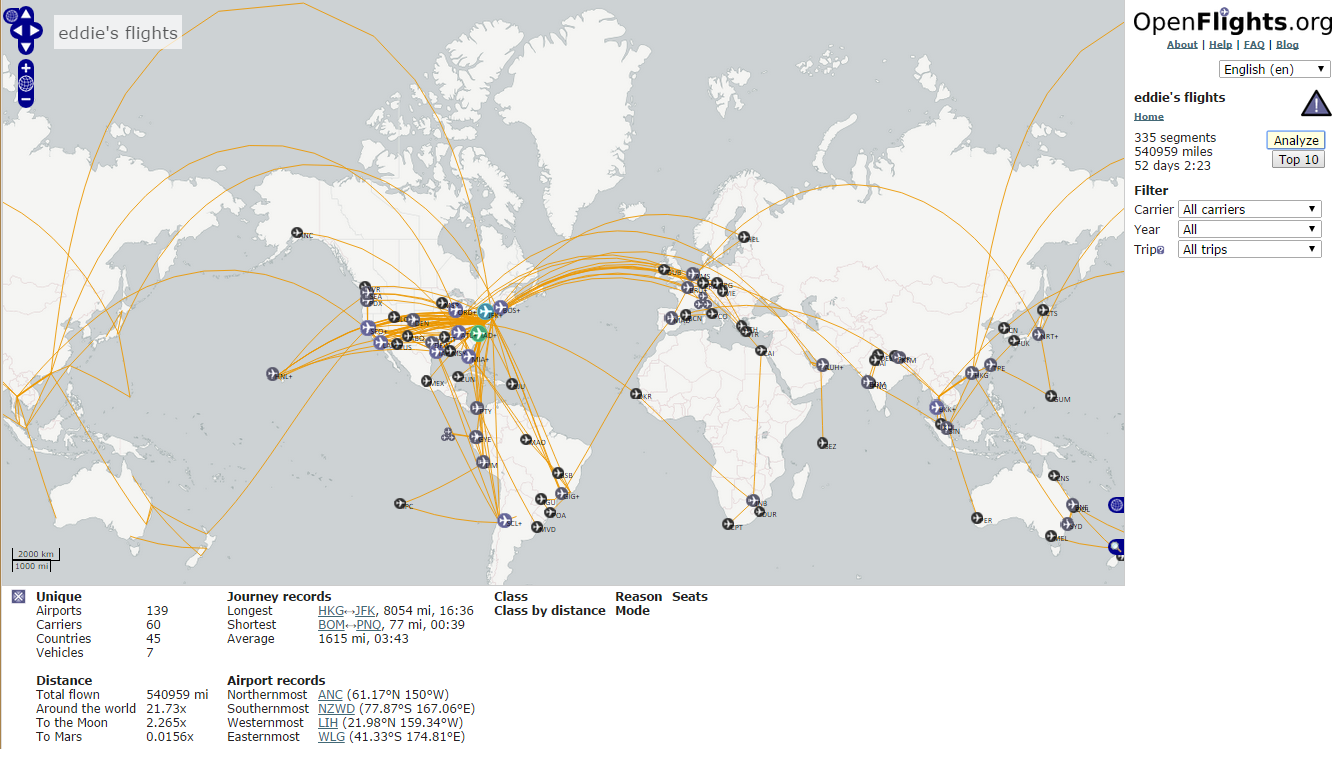 Name: Edward Dench
Description: All recorded flights I’ve taken.
Tools: Manual entry into openflights.org (there is an interface using TripIt though).
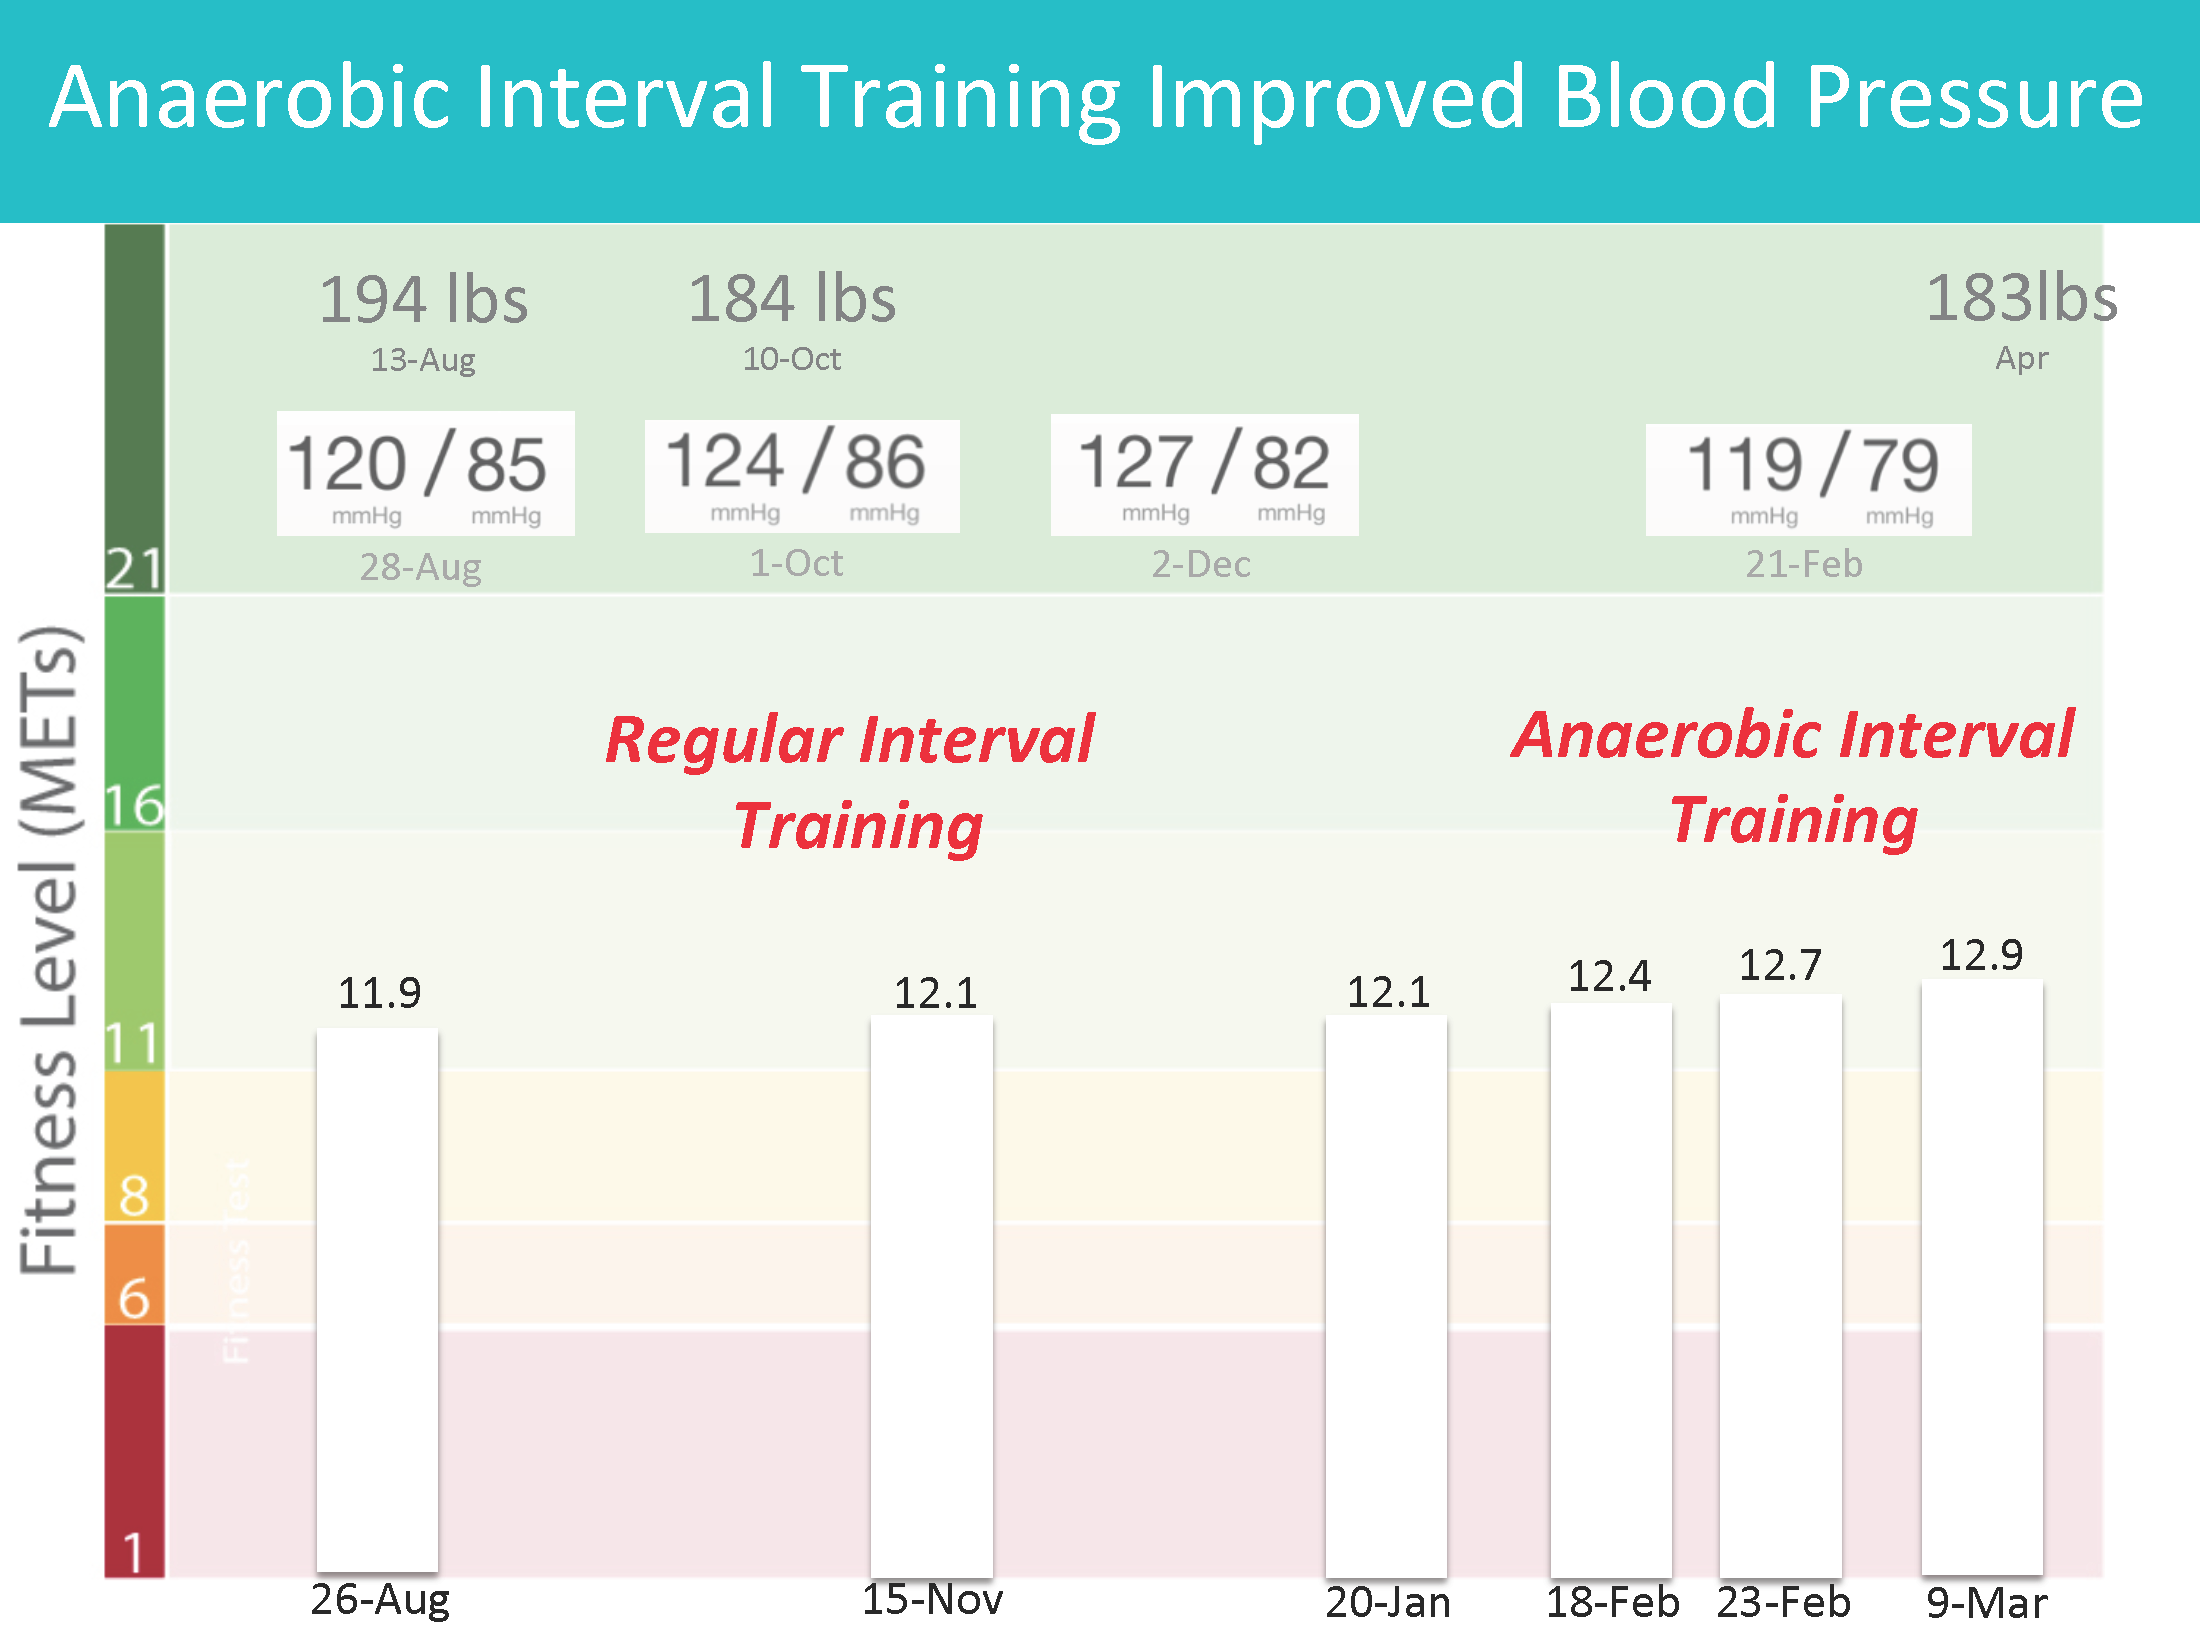 Name: Siva Raj
Description: After 6 months of regular exercise failed to improve my fitness and blood pressure levels, I switched to training above my endurance limit (anaerobic threshold). This was higher intensity but half the cycling time, yet my fitness and blood pressure improved within weeks.
Tools:Revvo – tracking fitness and intensity of workout; Withings – weight; iHealth BP Monitor – BP. Visualization created by overlaying Revvo screenshot with other information in photoshop.
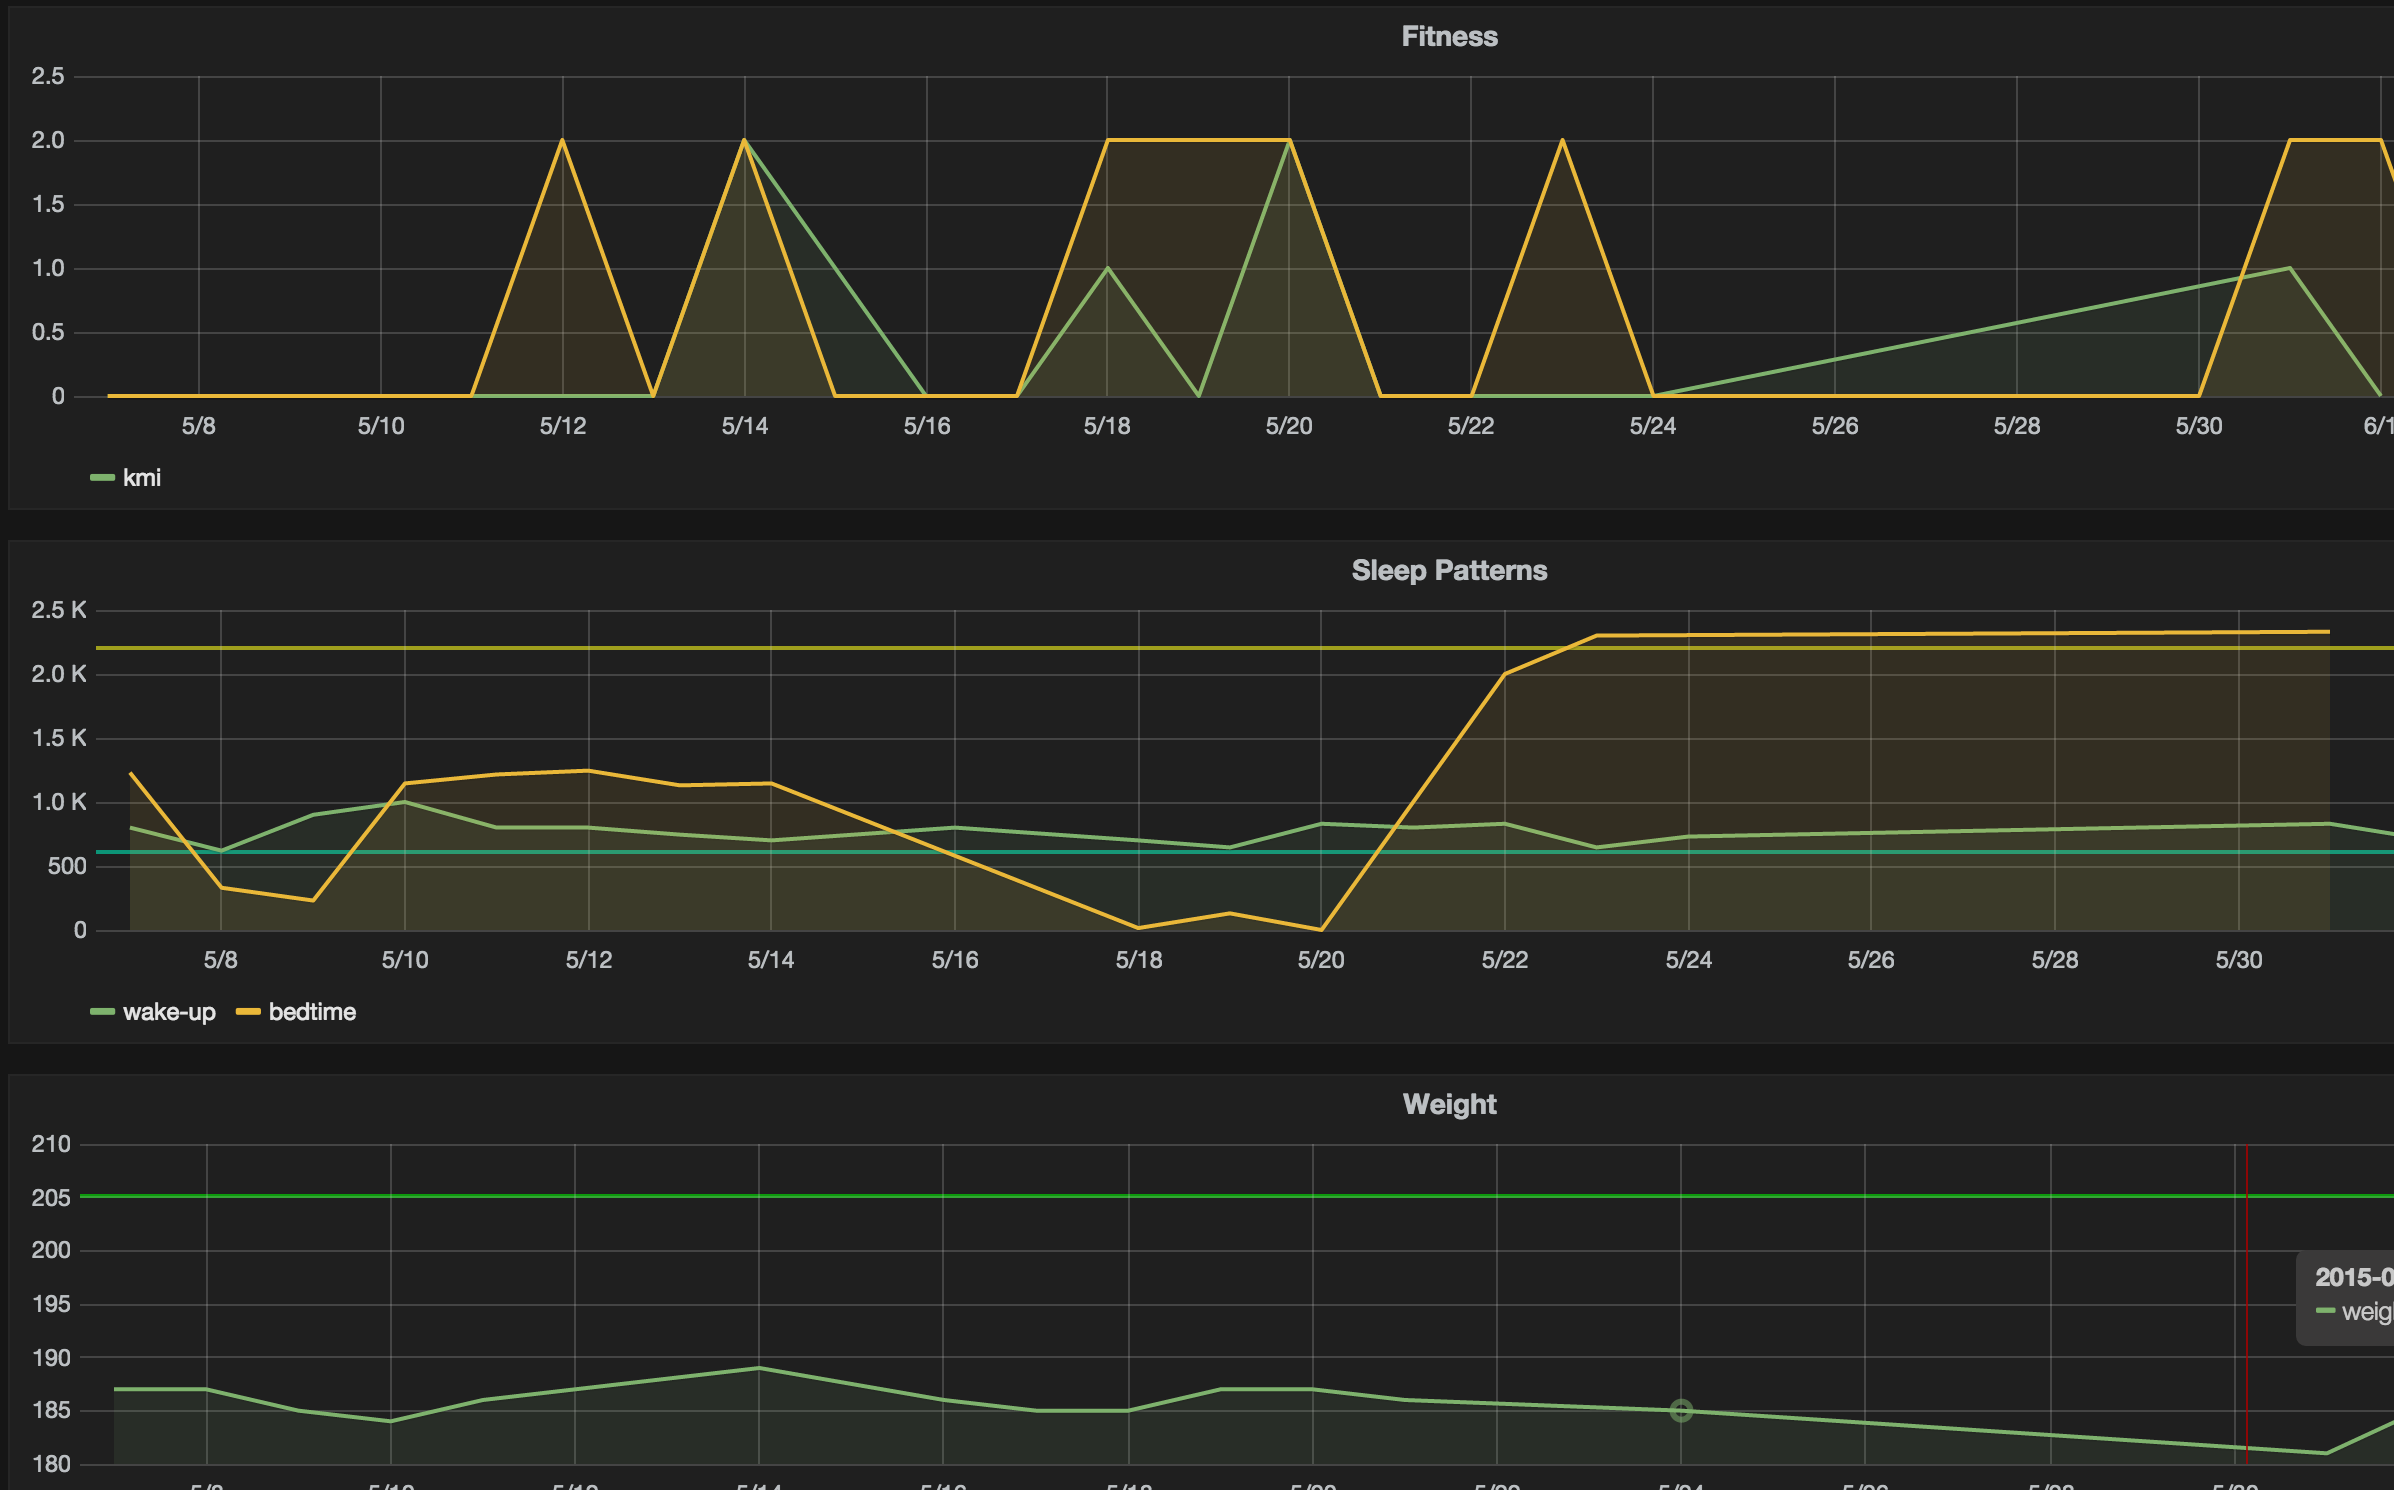 Name: Kurt Spindler
Description: Grafana is a common tool in the Software community to create beautiful dashboards to visualize server health (network, requests, workers, cpu, etc.) and therefore more easily diagnose problems. I created a custom iOS app that allows me to publish metrics to the same backend as Grafana, giving me Grafana dashboards for my personal health.
Tools:Custom iOS app, Grafana, Graphite
 Name: Ryan O’Donnell
Description: This semi-logarithmic graph is called the Standard Celeration Chart (SCC). It’s beauty is that anything a human does can be placed on this chart (i.e., standardized display). This also allows for cool metrics to be developed that lend well to predictability. I charted the number of pages that I read for my field of study, Behavior Analysis. I wrote a blog post on the display to speak some to the reading requirements suggested by professionals in the field. There were many variables that led to variations in reading rate, but the point of this work was to try and establish a steady reading repertoire. A recent probe in May of 2015 was at 2800 pages read. Essentially, I learned how to incorporate reading behavior analytic material almost daily in my life, which indirectly aids in the effectiveness I have as a practitioner and supervisor.
Tools: Standard Celeration Chart and paper-based data collection system (pages read each day on a sheet of paper).
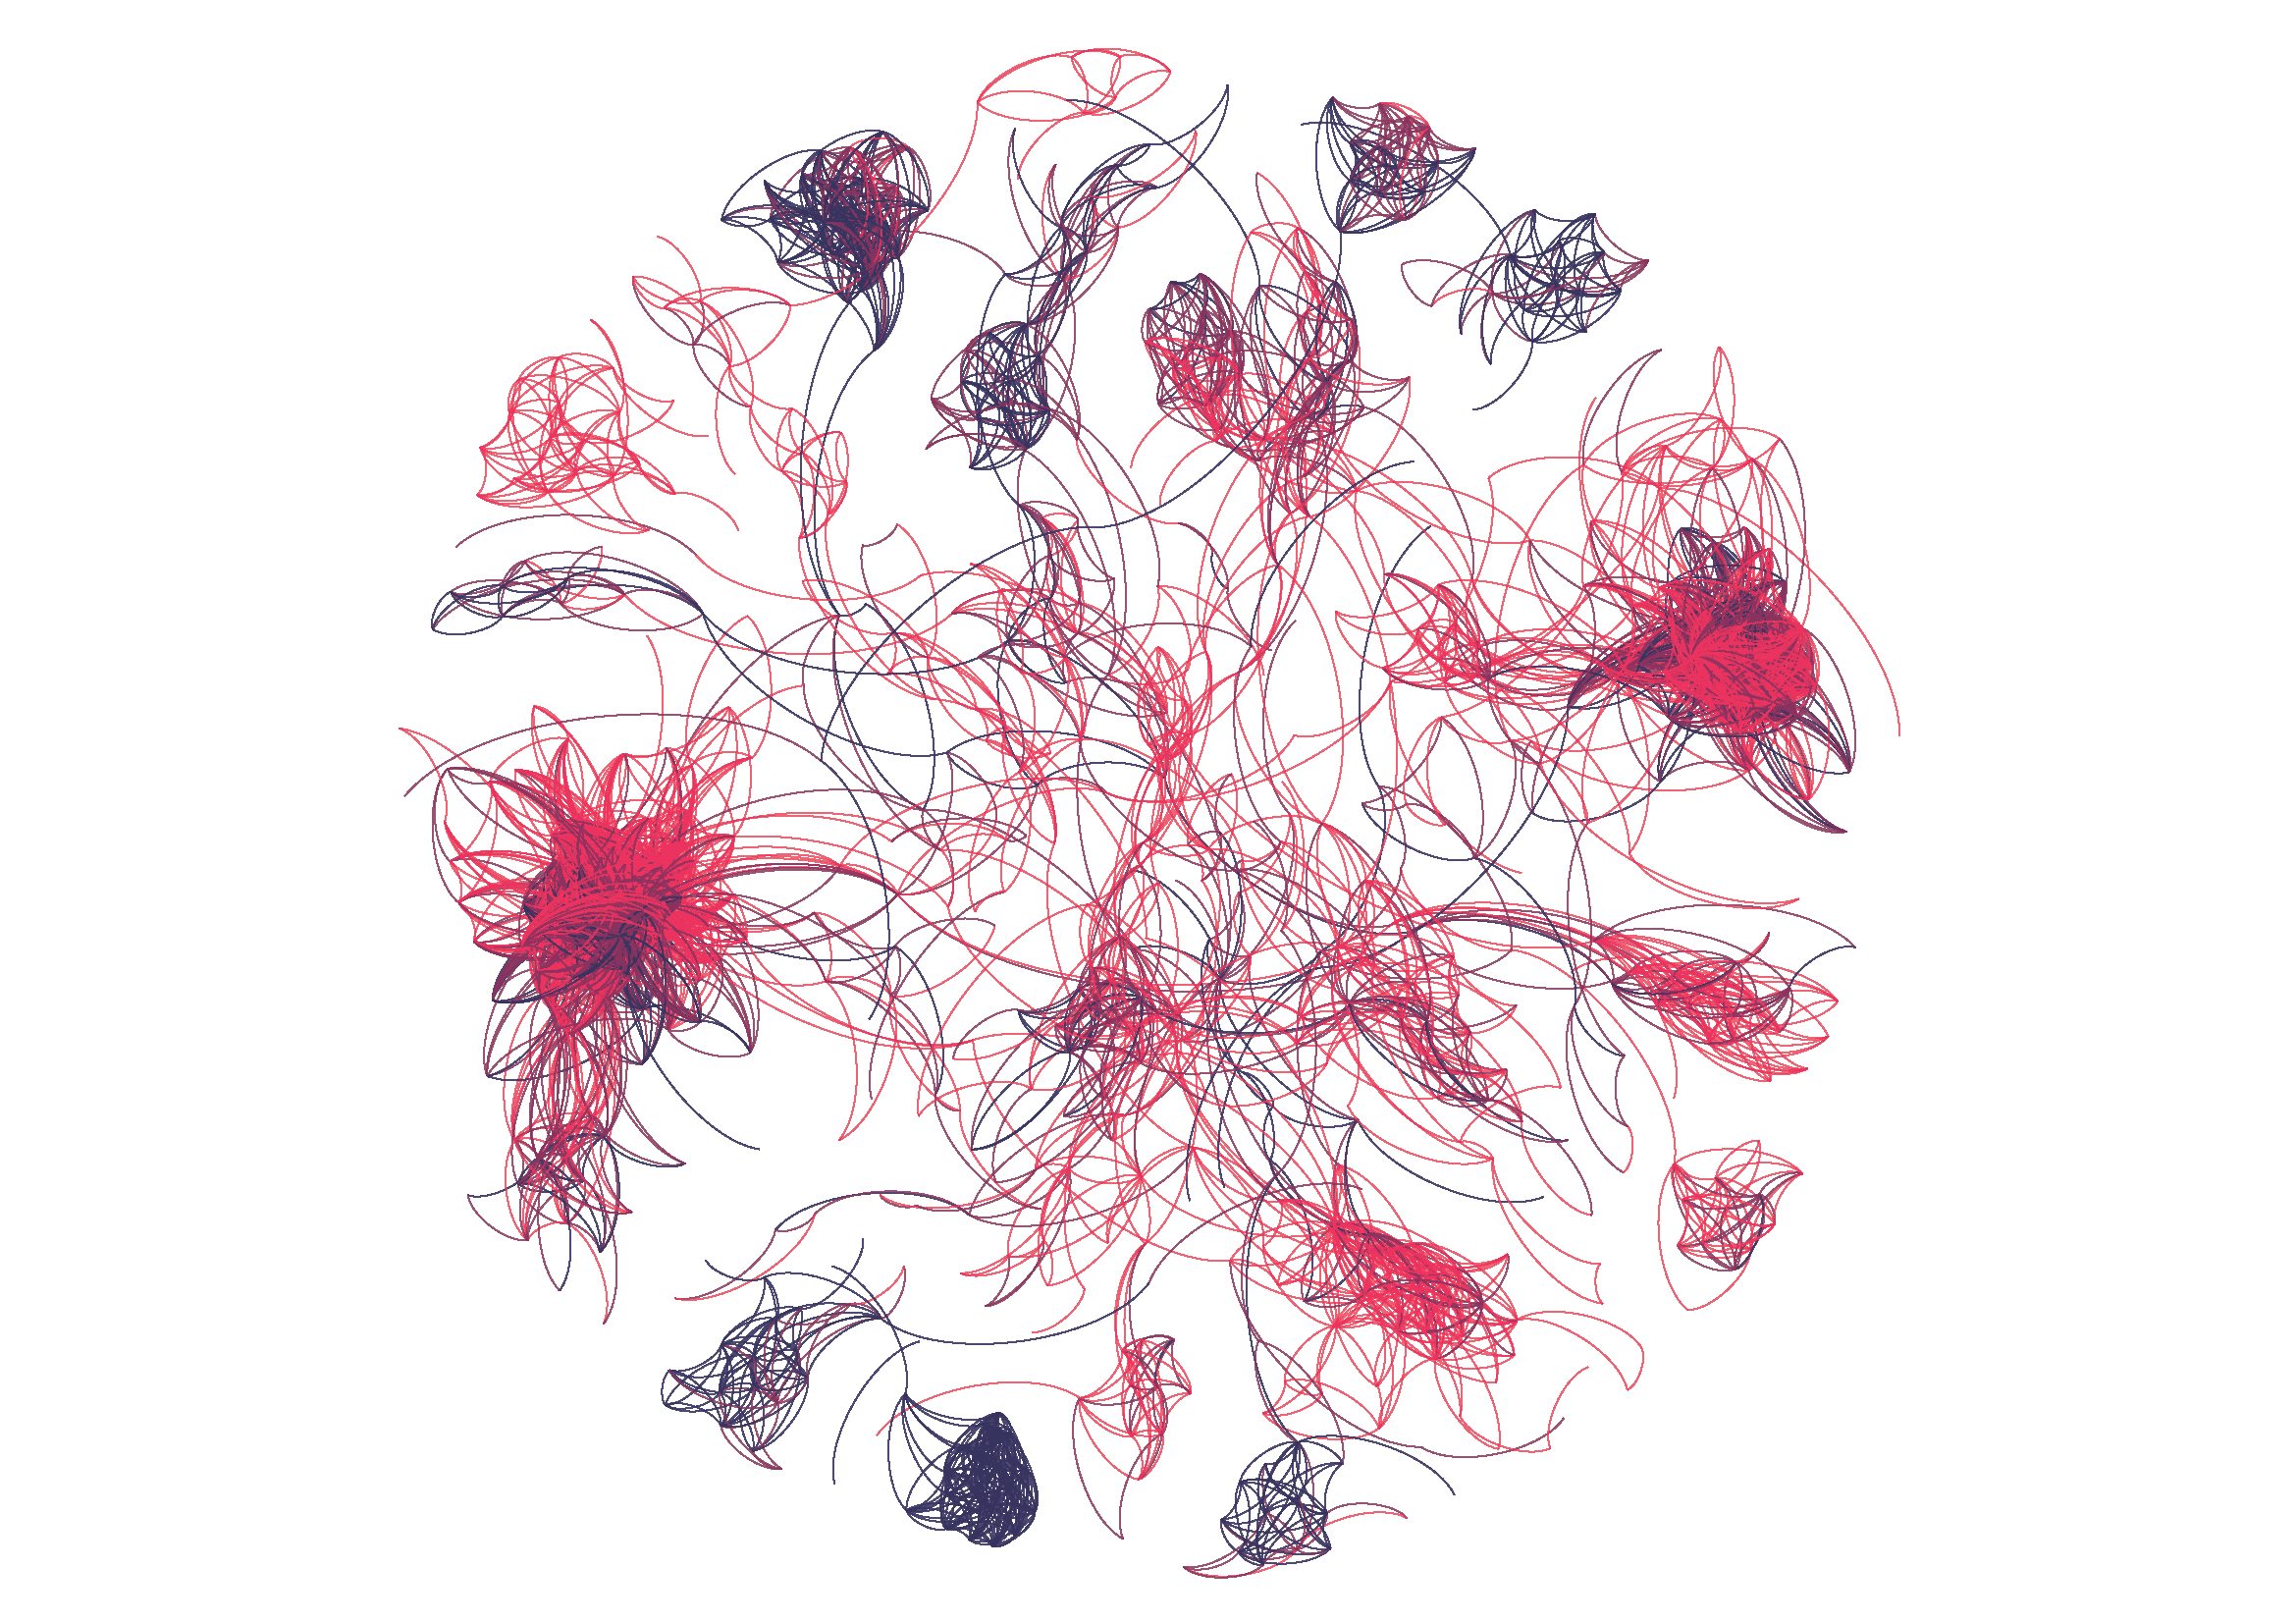 Name: Francois-Joseph Lapointe
Description: This *Microbial Selfie* depicts the gene similarity network among various families of bacteria sampled from my gut microbiome (red) and oral microbiome (black). Two bacteria are connected in the network when their gene sequences are more similar than a fixed threshold (80%). The different clusters thus identify bacterial families restricted to a single body site (red or black) versus those inhabiting multiple body sites (red and black).
Tools: In order to generate this data visualization, samples of my oral and gut microbiome have been sequenced on a MiSeq platform by means of 16S rRNA targeted amplicon sequencing, and the resulting data have been analyzed using QIIME, an open-source bioinformatics pipeline for performing microbiome analysis. The gene similarity network was produced with the open graph viz platform Gephi, using the Fruchterman–Reingold algorithm.
Stay tuned here for more QS Gallery visualizations in the coming weeks. If you’ve learned something that you are willing to share from seeing your own data in a chart or a graph, please send it along. We’d love to see more!

