Eric Boyd: Learning from my Nike FuelBand Data
Gary Wolf
April 5, 2013
We’ve been getting some great Quantified Self Show & Tell talks coming in as we get closer to our European conference. Now that there are so many self-tracking tools that can serve as tools for gaining insight into our actions and behaviors it’s important to understand what we can learn from the data we gather. One of the key questions Quantified Self participants have is whether the devices they use are accurate, what they are good for, what signals they display about our real activities.
Eric Boyd, who gave our keynote at the first QS conference in Palo Alto in 2011, is coming to Amsterdam in May, and he will give a show&tell talk about trying to understand his Nike Fuelband data. Eric has been involved with Quantified Self as an avid self-tracker, maker of wearable technologies, and an organizer for the QS Toronto meetup group.
 He has been wearing the Nike+ FueBband for a few months and has started to examine what the data tells him about his daily rhythms. For instance, it can easily tell when he gets out of bed at night, as well as daily variations in his walking pace.
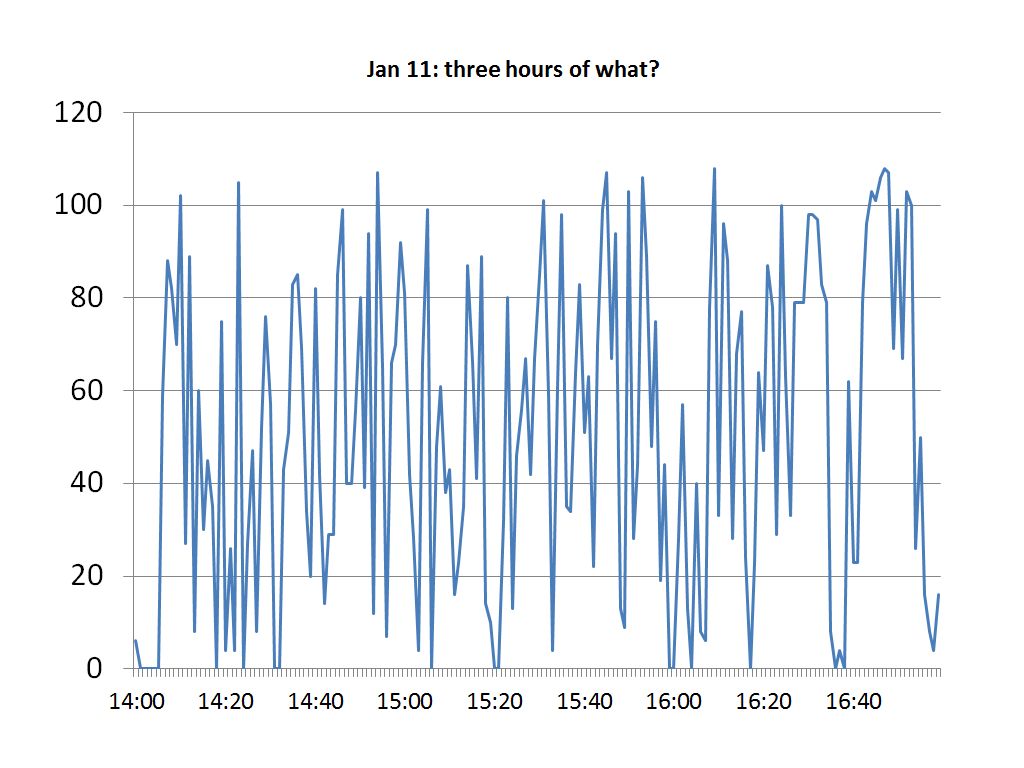
While many of us have found that the common activity trackers function as a kind of diary, with even the minimal traces of activity able to spur our memories about what we’ve been up to, sometimes they record data that is mysterious. For instance, the graph below show’s Eric’s highest activity day. “I do not know what I doing during the three hours when I clocked most of the steps, but it wasn’t walking,” he reports.
I think it will be fun, at the spring conference, to try and solve some of these mysteries of activity data together.
The Quantified Self European Conference will be held in Amsterdam on May 11th & 12th. Registration is now open. As with all our conferences our speakers are members of the community. If you’re attending the conference and want to present your self-tracking project please let us know.


