Ping’s Thesis – From Diary to Graph
Gary Wolf
September 12, 2008
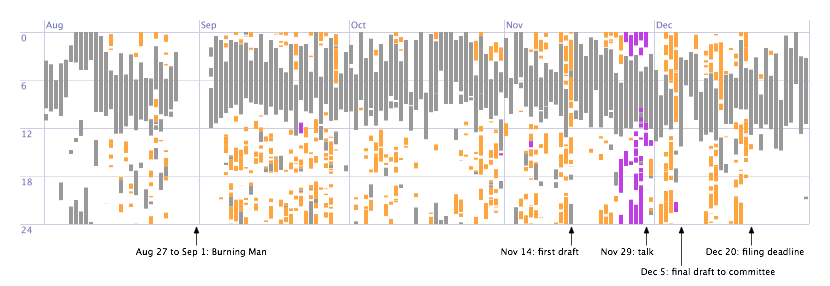
Yesterday I wrote about the inaugural QS Show&Tell, where the very first show-and-teller, Ka-Ping Yee, stood up and explained that he had been tracking most of his activities over the last three years. (I didn’t want to use his name or link to his entry until I asked permission, which he quickly granted.) Below is a chart of a recent period.
 The orange is writing and the grey is sleep. (He was working on his dissertation at the time.) The large gap on the left hand side is when he went to burning man. Ping collects this data using a widget he wrote. There is a text box in the upper right hand side of screen, and he simply keeps a brief log of his activity. He writes a few words, and a time stamp is automatically added. Duration is calculated by subtracting the time one activity began from the time the subsequent activity began. He can edit the text, which allows him to note activity that takes place away from the computer; he just catches up on his list when he’s back. And by using some keywords – for instance, “fun” – in the text, he can easily write a script to graph the allocation of his time.
I liked this idea, because it permits Ping to log his actions in normal written language, but also allows him to gather data and graph it. No natural language processing AI needed!


