Hot Stuff: Body Temperature Tracking and Ovulatory Cycles
Azure Grant
April 22, 2017
For the past eight months I’ve been tracking my temperature every minute using small, wireless sensors.
I work in a lab that recently showed minute-by-minute body temperature can tell you fascinating things about female physiology, at least in mice. Using temperature, we can tell what day a mouse will ovulate, whether or not it will become pregnant within hours of pairing with a male, and in the same time, whether or not its pregnancy will be successful. Just as interesting, the temperature reveals that some mice have stable ovulatory cycles and some don’t. We wanted to see if any of this holds up in humans (read: lab mates, a sporting family member and myself). I’ll show you what we did, what we found, and how to get started if you’d like to start tracking your temperature too.
Why Temperature?
Think of metabolism as a continuous symphony and body temperature as the din that carries through the concert hall walls.
Many of the metabolic reactions taking place throughout our bodies generate small amounts of heat and are actually coordinated in a similar way to musical chords. For example, during the luteal phase of the menstrual cycle progesterone levels will pulse in concert with estradiol, often following a luteinizing hormone pulse occurring 15 minutes prior. These fluctuations, as well as other things that affect metabolism (ovulating, eating a meal, etc.), translate into small temperature ripples which register on the surface of the body.
Temperature has long been used as a predictor of ovulation. But most temperature based techniques rely on a single measurement per day. Limiting data collection to one time point per day is the equivalent of listening to the symphony only at what we hope is the crescendo of each piece: with training, we might identify the chord, but we’ll still miss most of the show.
What are we doing and what have we seen already?
To see if we could use high temporal resolution temperature to recapitulate any of our previous findings, we began monitoring distal (wrist), axial (arm-pit) and core (ahem, core) temperatures every minute, using small devices called iButtons. We’ve seen some interesting things so far. I’ve shown the temperature data as a heat map, because it allows you to see many measurements while giving a clear picture of the overall pattern of rising and falling average temperatures over the course of 28 days.
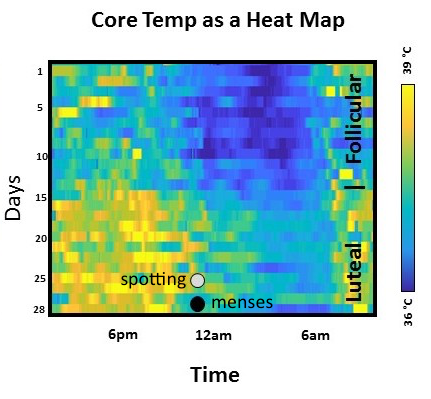
Temperature Can Predict the Start of Menstruation.
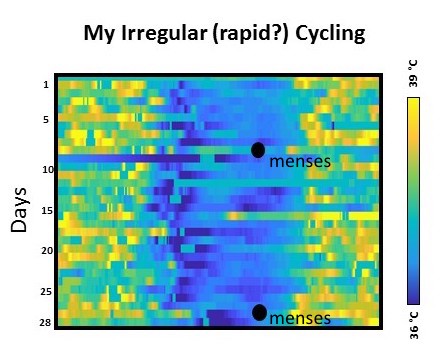
In the graph above, which uses my lab mate’s data, you’ll see that the range of temperatures she passes through in a day shifts a little higher every day leading up to the start of spotting/ menstruation. This timing is clear in her data, but it isn’t identical for everyone, though. My cycles are irregular and the chart below shows that menstruation starts when my average temperature reaches its highest level of the month. Note that this can be more than once per 28 days, as in the month graphed below.
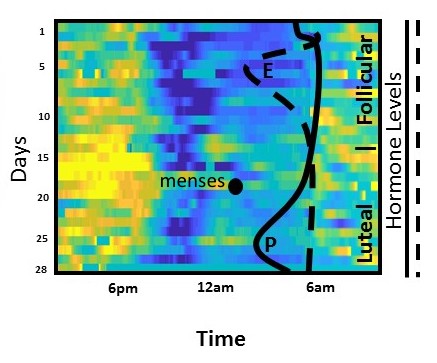
In my mom’s case, the heat map below clearly shows the shift between follicular (cooler) and luteal (warmer) phases. I’ve outlined the profiles of the Progesterone (P) and Estrogen (E) that my mom takes each day as part of hormone replacement therapy. In the valley where both hormones are low, she transitions from follicular to luteal phase. This corresponds to a temperature increase, and a few days later she gets her period.
These findings keep us coming back for more: more subjects and more longitudinal data for each of us. Perhaps the differences we have observed between us support that there are different ‘types’ of cyclers in the population, just as there are different body types. And maybe the temperature features we have in common will apply to other women.
So how do we gather the data (and how might you)?

iButtons are about the size of the button on your jeans, and one side has a sensor which is worn pressed to the skin. A sweat band is enough to secure one button to your wrist, and the axial button can be tucked into a bra strap or secured with a non-irritating skin tape (here is my favorite so far). Body temperature shouldn’t ever fluctuate more than a couple of degrees C, so devices with high precision are key. This model is accurate up to .0625 C. Both the resolution and the sampling rate can be user-specified, meaning you can take very precise measurements very frequently. I find that anywhere between one and three-minute resolution works well to capture changes throughout the day.
iButtons don’t ever need to charge, but the data needs to be read once the memory fills up. Depending on the sampling rate, that’s every 3-7 days. At the end of a recording period, the ibutton is touched to its reader, and a simple interface allows the user to view the data and export it as a csv. iButton will plot the data, but it won’t do any further analysis. We’ve taken these csv outputs into Matlab and Python for our analyses, and because they are widely used formats, anyone could make graphs and start to play with their data. I’m not associated with the company, but I’m excited to share what we’re finding and want others to know how to jump in. An ibutton and a reader together cost about $100.
Interested?
Temperature tracking is a scavenger hunt: we don’t know precisely what we’re looking for, but clues keep turning up that lead us in interesting and verifiable directions. Multiple hormonal systems in our bodies (the stress axis, the digestive system, the thyroid axis) affect body temperature, and the reproductive system is just one of those. This raises the question: could we see predictable changes in temperature associated with a long run, a large meal, or a bad night of sleep? Probably. Mapping the personal, research, and clinical applications of high temporal resolution body temperature tracking will take time and user participation. Luckily, it gives interesting and useful personal feedback along the way.

