Jamie Williams: Exploring my Data
Ernesto Ramirez
October 31, 2014
Jamie Williams found himself with almost two years of self-tracking data including physical activity, blood pressure, and weight. Because of his interest in data visualization and coding he decided to learn how to access it the data and work on visualizing and understanding some of the trends and patterns. In this talk, presented at the QS St. Louis meetup group, he takes a deep dive into his activity and step data as well as his blood pressure data to learn about himself and what affects his behavior and associated data.
What Did Jamie Do?
Out of pure interest in seeing what the data would reveal, Jamie utilized a combination of devices to track his physical activity, blood pressure, heart rate, weight, numbers of drinks, and automobile travel. He then went on to explore ways in which he could pull down, integrate, visualize, and ultimately make sense of what he collected.
How Did He Do It?
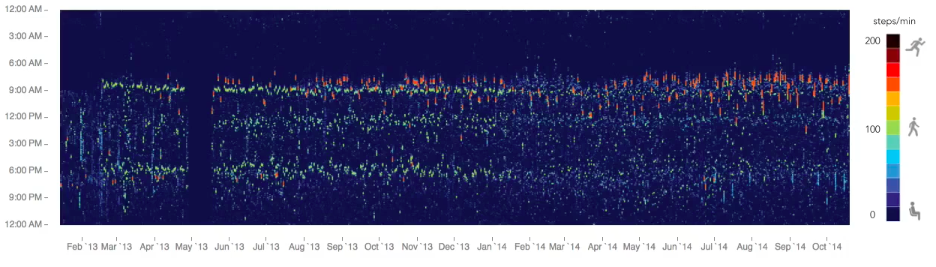
In order to obtain his data on a minute-level resolution, Jamie had to email FitBit for a specialized use of their API. He then employed Mathematica to develop a number of (beautiful) visualizations of his activity – along with other key moments in his life (moving to St. Louis, changing job location, preparing for a Half Marathon, etc.). Jamie was able to compare his data not only to his peers through FitBit, but also to others of his demographic in the U.S. using the publicily available NHANES data set.
What Did He Learn?
Through Jamie’s Quantified Self collection and analysis efforts, he learned a lot not only about the patterns and changes in his activity, but why they were the case. He also presented great feedback about one’s mindset when comparing to peers vs. the general population.
Tools
Fitbit
Withing Blood Pressure Cuff
AskMeEvery.com
Automatic
Mathematica
D3.js
Python
Thank you to QS St. Louis organizer, William Dahl, and Jamie for the original posting of this talk!

