How to Map Your Moves Data
Ernesto Ramirez
March 14, 2014
In the Quantified Self community we focus on projects and ideas that help people access and get meaning out their personal data, including the information you can collect with your smartphone. If you have an iPhone, Android, or Windows phone you’re already have carrying of the world’s most sophisticated self-tracking tools. The GPS, accelerometer, the microphone, all of these tiny sensors make up a great set of tools you can use to understand how you move around the world.
I’m going to focus this short “how to” on geolocation data and mapping your movement, specifically using data gathered by the Moves application. Moves is a passive activity and location tracking tool available for the iPhone and Android. We’ve written a bit about it in the past and had a chance to interview their CEO, Sampo Karjalainen. I’ve been using it since May, 2013 and I wanted to share some neat tools and methods for getting a bit more out of the data Moves collects.
I find that visualizing my data on a map to be incredibly powerful. It might by my inner cartographer, but seeing my patterns of movement (or lack there of) in reference to known places and landmarks is a great mechanism for inducing recall and reflection on where I’ve been and what I’ve done. Hopefully you’ll use one of the tools or methods below to map you data and learn something new!
Moves Connected Apps
Like many self-tracking applications and devices, Moves has a API that many different developers have built services on top of. Here are just a few of the services that allow you to see your data on a map. Be advised that each of these services has access to your data. Make sure to read their Terms of Service before agreeing to the data transfer.
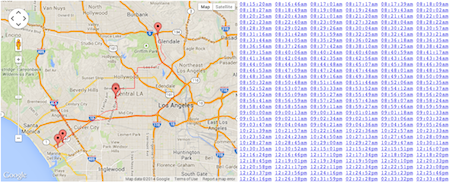
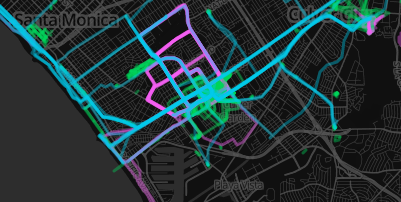
WebTrack. This is by far the most utilitarian data mapping tool. However, you shouldn’t get discouraged by the lack of fancy design because it gives you an very unique data view. When you use Moves on your phone you typically only see the “storyline” and the detected places you’ve spent time at. However, Moves is constantly pinging and recording your location when it detects movement. WebTrack allows you to see all those movement points by hovering over the associated timestamp.
Fluxtream. You might know Fluxtream as Friend of QS and a great open-source data aggregation tool. They’ve set up a “Moves Connector” that allows you to import and visualize your Moves data. Because Fluxtream is set up as an aggregation and visualization tool you can also map other interesting data sets. Want to know where you were tweeting last week? Fluxtream will map it for you. (You can see me tweeting on a CalTrain ride between San Francisco and Palo Alto below.)

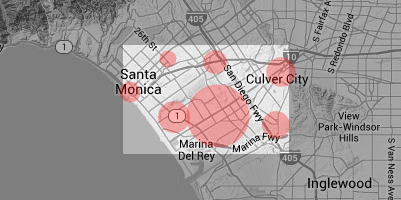
Zenobase. Another interesting data aggregation service here. Zenobase treats your Moves data bit differently. Rather than importing all the movement geolocation data it focuses on your place data and visualizes those locations. I like the high-level view it start with, but make sure to keep zooming in to see more specific place data.
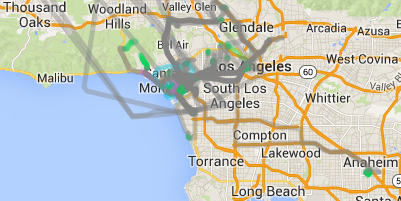
Resvan Maps. This mapping application adds a unique twist to the typical mapping visualizations. It will plot your places, paths, and categorize paths depending on the activity (transport, walking, running, and cycling). Additionally, you can create “analysis cirlces” and have the application compute the time you spent in a certain location you bound (it aggregates to hours:minutes per day).
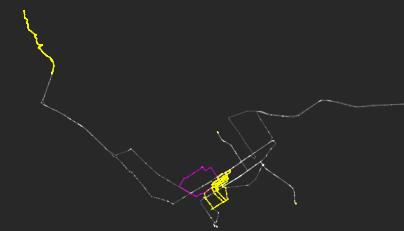
MMapper. This method for mapping your data, developed by Nicholas Felton, is by far the most technical, but it produces some really neat visualizations. You’ll have to download Processing and follow the instructions Nicholas provides on the Github repository page here. The great thing here is that the mapping and data access is all happening locally.
Move-O-Scope. Another great mapping application here from the folks at Halftone.co. They’ve probably completed the most thorough mapping and exploration tools for your Moves data. After linking your Moves account you can explore maps by activity type, day of the week, and custom data ranges. Additionally, they’ve implemented a neat feature for exploring place data. You can see how many times you’ve visited a specific place, where you’ve come from and where you go next, what days you typically visit, and your typical time of day at that place. (See this post for background on why they created this nifty tool.)
Map It Yourself!
If you don’t want to trust your data to a third party, but you still want to explore your movement maps there is really great option for you. Our friend and co-organizer of the QS LA Meetup, Eric Blue, recently published a method for easily exporting your data: the Moves CSV Exporter. You’ll have to login and use the Moves pin system in order to download your data, but Traqs isn’t storing your data, just providing a way for you to access it. The tool allows you to download and explore your activity, summary, tracks and place data. We’ll focus on the place data for creating maps. You can also use your full tracks history for mapping all the geolocation points Moves collects.
Because this data is based on latitude/longitude coordinates there are many different methods available that you can use to map your data. I’m going to focus on two here: Google Fusion Tables and CartoDB (if you know of others share them in the comments or our forum).
Google Fusion Tables
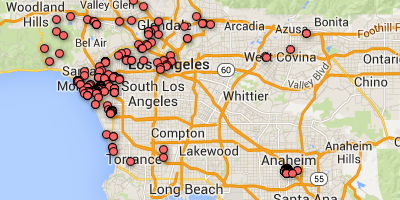
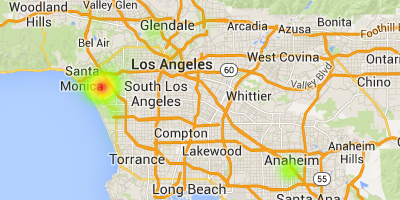
Fusion Tables are a new Google Drive tool that you can use to store, analyze, and visualize many different types of data. Once you download your Moves places.csv file you can upload it to a new Google Fusion Table. Once you upload your data, which takes about 2 minutes, you’ll see a menu bar and three tabs: Rows, Cards, Map of longitude. Just click on the “Map” tab and you’ll see your data already placed on a map. If you want to see a heatmap rather than a point map just navigate to Tools -> Change Map and you’ll see an option for a heatmap on the lefthand side. This is just the tip of iceberg for mapping fusion table data. You can learn more about different mapping methods and tricks here.
CartoDB
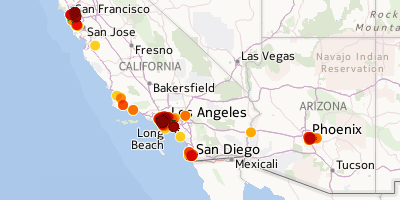
CartoDB is a visualization and analysis engine for geospatial data. I’ve been using it to play around with a few of the different geolocation datasets that I have (I actively keep three). Although it is paid service, they do offer a free plan for smaller datasets, which is perfect for your Moves data. Again, you’ll have to upload your places.csv file to a new table once you set up your account. Once the data is uploaded there are quite a few different map visualization wizards you can use to view your data in different ways. Pesonaly I like playing with the “Torque” visualization that gives you a real feeling of space-time to your data.
TileMill
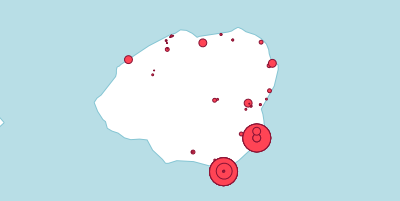
TileMill is an interactive map design tool from the folks over at Mapbox. If you’re looking to create custom maps with your data that you can format, style, and share then this is a wonderful tool to use. At first glance it’s a little daunting because it looks like a mashup of a CSS editor and map tool. That actually gives it the unique power to drive customization. Don’t be afraid, it’s not too hard to get started with. Mapbox has provided a great “crashcourse” to get you started with importing data, saving it as a new layer on your map, and then manipulating how it looks on your screen. If you want to go just a bit farther you can also add legends and informative popups to describe your data points. Mapbox also offers a free hosting plan if you want to share your interactive maps on a webpage. For example check out my MovesMap here, where I added a quick styling to manipulate the point size in relation to the time spent at a location.
(Update 4/24/14: Mapbox has posted an excellent how-to for mapping Moves data with the new official Moves export data function. Check it out here.)
Hopefully you’ve learned something new from this. If you map your Moves data (or any other geolocation data) we want to see it! Leave a link in the comments, post it in the location mapping thread on the QS Forum or get in touch on twitter!

