Numbers From Around The Web: Round 10
Ernesto Ramirez
August 16, 2012
At some point, we’ve all been frustrated with our experiences interacting with the medical community. This isn’t a big secret, especially here in the United States. Many individuals involved in QS meetups around the world gravitate towards news tools and data sources that let them understand and interact with health-related data in news ways. Whether it’s because of a genuine medical issue or just out of curiosity, examples of tracking and visualizing medical data are always really interesting. With that in mind we wanted to highlight a neat health tracking project this week.
Kenneth Spriggs has Crohn’s disease and he’s been collecting and making sense of his medical records since the summer of 2011. Along with trying to better understand his own medical history, partly to understand what went right and what went wrong, he’s also spent some time creating some really unique and interesting visualizations. Let’s dive right in and see what he’s done!
Medical Lifeline
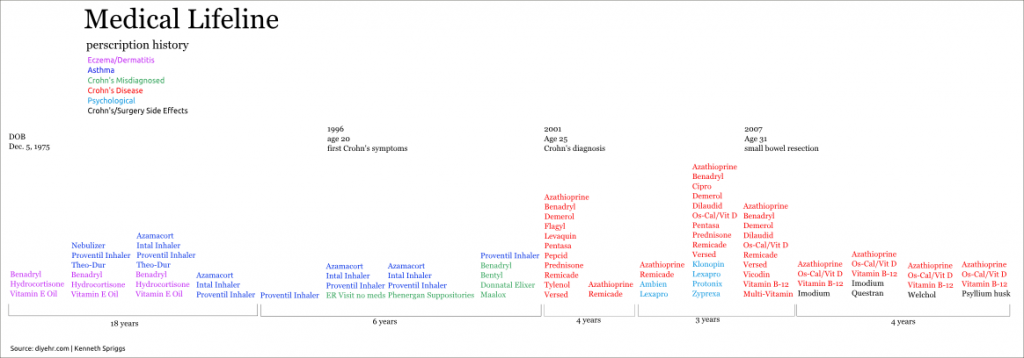
How many different medications have you been on during your lifetime? Probably not the easiest question to answer unless you’ve been with the same medical system your entire life. One of Kenneth’s first forays into his medical data and visualizations was trying to represent My Life on Drugs. Admittedly a hard process that probably required a lot of patience and persistence, Kenneth was able to create a really nice timeline that illustrates his medical history through his medication.
10 Years of Crohn’s
If you don’t read anything else about Kenneths, his ordeal, and his experience working with his own medical data you should take a look at his amazing 10 Years of Crohn’s Disease infographic and accompanying commentary. As you’ll see Kenneth did a wonderful job working with his numerical health data as well as written notes, diagrams, and other information sources to paint a picture of how Crohn’s disease has impacted his life. Let’s just look at a few sections here.
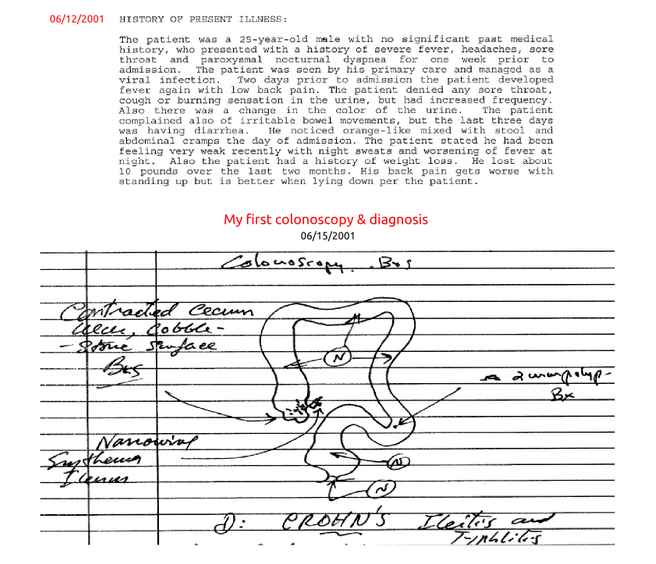
The diagnosis portion of his medical infographic is one part that I find really interesting. Many times we think of QS as only dealing with numerical data, but in the medical universe data can come in all shapes and sizes. By looking at notes and diagrams along with other vital information Kenneth was able to create a much clearer picture of his history.
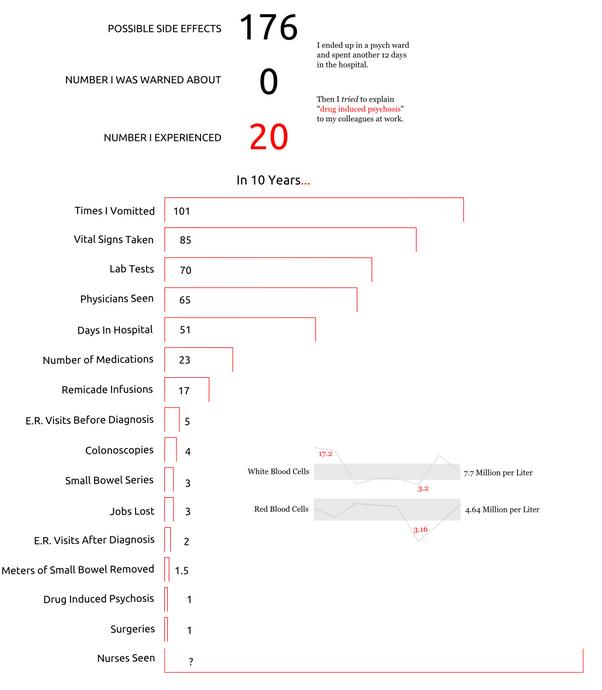
After Kenneth was diagnosed with Crohn’s disease he was prescribed five different medications. Here you’ll see the number of side effects he found for those medications and what he’s experienced. Along with his medication and side effect history you’ll see a histogram of his life history over the last 10 years.
There are so many data gathering and sense-making insights that Kenneth has has done a wonderful job of exploring and explaining. If you’re interested in compiling your own medical history and creating your own electronic health record then make sure to take some time perusing DIYEHR .
Every few weeks be on the lookout for new posts profiling interesting individuals and their data. If you have an interesting story or link to share leave a comment or contact the author here.


