Numbers from Around the Web: The Simple, Wonderful Art of Tracking
Ernesto Ramirez
February 18, 2012
This is a special NFTAW post on a project we think is full of insight and beauty.
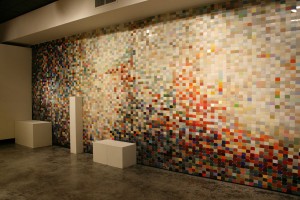
For those of you that were lucky enough to attend the first European Quantified Self conference this past November in Amsterdam you know how inspiring our good friend Laurie Frick can be. Laurie is a visual artist who meticulously and beautifully morphs her own self tracking data into wonderful pieces of art. Personally I find her large scale mood wall installations to be just jaw-dropping.
Phenomenal in her own right, imagine how surprised we were when Laurie emailed us earlier this week to tell us about an amazing story of a school teacher bringing self-tracking and visualization into her classroom. I’ll let Abigail Soto, an art teacher at De Valle High School in Austin Texas, tell you what happened in her own words:
24 hours in the life of a Del Valle student.
On February 1st, 2012 I attended the energetic and interesting gallery talk of Laurie Frick at Women & Their Work in Austin. She counted and tracked her everyday life and inspired me to have my high school student track their lives. My high school is very high poverty and my students have very little opportunity to see art and art galleries. My students love hearing stories about artists and galleries and I couldn’t wait to share my experience from the gallery talk.
On February 2nd I came to school and changed my lesson plan to include the students tracking their lives. I gave the students 24 rectangles in a line on a pre-printed sheet. I simply told them to track their previous 24 hours. One rectangle equaled one hour. The students collectively created a unified key with teenage issues. Blue signified sleep, red for school, pink for makeup, green for cell phone use etc… I did not give them any more requirements. My literal students started at a specific time and chronologically recorded their day while other students recreated their day in a more abstract manor.
The students really had to think about the length of their activities and many were shocked to find out how they spent their time. Students generated many great questions about the project and the artist. Conversations began about the amount of texting in the thousands and how much time is consumed with electronics. A great idea would be to illustrate and calculate the amount of text messages that are sent and received by each student. Some students text over 1000 times per day. Teacher and homework time can hardly compete with cell phones, television, and video games. Just by evaluating their actions they were able to visually see where they placed importance and how they should choose their time wisely.
Once each student completed their color chart they were placed in the hallway for the entire school to see. The key was placed to the side of the color charts and students walking down the hall stopped to figure out what the colors meant. The curiosity grew and non-art students were walking in my classroom asking if they could record their day. The overall experience has been very interesting. I have never been exposed to tracking and have never included tracking in an art lesson. I would like to take this lesson a step farther and do a complete lesson and art installation with my high school students. I think the possibilities are endless. Thank you Laurie Frick for expanding the possibilities in my classroom.
I think that there are a lot of lessons here that we as a community of users and makers can take away. Sometimes we get caught up in the gadgets and new technologies that we associated with real objective data collection. While those tools and web services are fun and provide us with new insights into our lives we mustn’t forget that the tools doesn’t make the tracking happen, it just makes it easier. I was asked at a conference this past week, “All those gadgets are nice, but what about the people who can’t afford them? What do you say to those people?” I think that implementing projects such as the one illustrated by Abigail Soto here is a way to bring people from all walks of life into a practice of self-tracking. Amazing insights can happen with a piece of paper, some lines, and a few colored markers. As an aside, during this same conference I met a woman whose 83 year old mother has been meticulously tracking her blood pressure and blood glucose, not with a fancy smartphone of wifi enabled device, but with good old pen and paper.
The second major lesson I took away from this project is that Quantified Self is a community in the truest sense of the world. We (and if you’re reading this that “we” includes you too) work hard to make sure that anyone and everyone feels that they can take part. Whether it is at a meetup, at a large conference, or in one-on-one discussions there is an amazing current of inclusivity, of togetherness, of intimate and abundant sharing. I’ve never once heard someone pipe up and say, “That’s not self-tracking.” As I read Abigail’s description and looked through those beautiful pieces of data visualization it made me proud that she and her students could feel included in this wonderful movement we are all a part of.
We’ll be highlighting more art projects and self-tracking experiments in future NFATW posts so please feel free to drop me a line and share your story or point out someone’s you’ve seen or read about. Our strength lies in our courage to share with each other.


