Personal Informatics in Practice − Lullaby: Capturing the Unconscious in the Sleep Environment
Ian Li
March 27, 2012
Matthew Kay is a PhD student in Computer Science & Engineering at the University of Washington. He develops technology to help people understand and improve their sleep habits, motivated partially by his own poor sleep habits. He works with Julie Kientz and Shwetak Patel.
Clinical sleep centers can easily evaluate a person’s sleep quality, but because these tests do not occur in the home, they cannot help identify factors in the bedroom that might make their sleep quality worse. A variety of personal informatics tools exist for sleep tracking—e.g. Zeo and Fitbit. These tools automatically measure sleep quality, but generally leave other factors to be self-reported.
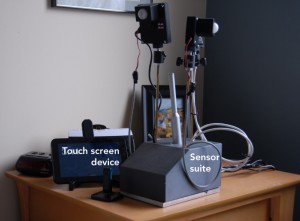
One of the goals of the Lullaby project is to add environmental data to the automated sleep-tracking process. Lullaby is a suite of environmental sensors—including sound, light, temperature, and motion—combined into a system about the size of a bedside lamp. Using an Android tablet, Lullaby presents the environmental data it collects together with data from an off-the-shelf sleep tracking device, like a Zeo or Fitbit, to help people determine what is disrupting their sleep and how they can improve their sleep environment.
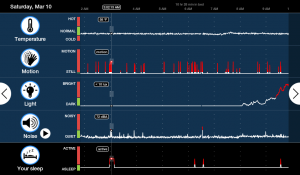
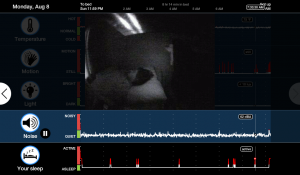
Using Lullaby, we have begun to explore what can be done with multi-faceted data streams in personal informatics. Combining all of our data streams into the same user interface is the simplest first step; users can see the temperature, light level, sound, motion, and sleep quality data from each moment over the course of the night (below, left). They can also play back the audio and show images collected by an infrared camera alongside their data (below, right). By combining multiple data streams together, we can start to paint a more complete picture of a person’s sleep and sleep environment.


Capturing unconscious experience
There are some interesting challenges for lifelogging when the events recorded by a system occur while the user is unconscious. When capturing spontaneous events, such as with systems like SenseCam, arguably users are aware of the occurrence of the event as it happens or shortly thereafter. In contrast, the domain of sleep is one where events of interest are not known by users until well after their occurrence, when the user goes looking for them. Sleep, as far as conscious experience is concerned, is a “black box”.
On the one hand, this makes it a fascinating area to explore: a Lullaby user myself, I find it very interesting to play back parts of my sleep and to see how much I move around. Indeed, many of our users are surprised by how much they move around during sleep.
On the other hand, this presents a challenge: How do we help people find those events of interest within an 8-hour chunk of time they did not consciously experience? We try to provide guidance in this process by highlighting data that is out-of-range according to recommendations from sleep literature (and thus possibly of interest); for example, if the temperature goes over 75 degrees, the recommended max bedroom temperature according to the National Sleep Foundation, it will be shown in red on the graphs. In the future, we aim to further improve the process of finding moments of interest by adding intelligent video and audio summaries, for example, by employing computer vision techniques.
High-level inferences
We are also looking at more sophisticated ways of combining the data we collect and have been testing prototype interfaces of graphical summaries and visualizations. We have found interesting results from our current deployment, such as one user with a (weak, but existent) correlation between temperature and sleep quality: as the temperature in their room goes up by a few degrees, their sleep quality dips slightly.
Looking at a result like this, we can ask: what is the best way for a self-tracking system to organize and present its data so that the user can find and understand this correlation? For example, we could present this user with a scatter plot of sleep quality and temperature and a trendline (we can even do this for all of the factors recorded). However, we can boil this data down even further. What if your sleep-tracking device told you: “When your room temperature goes up by 5 degrees, your sleep efficiency decreases by 10%. You should consider setting your thermostat to 65 degrees to get the best sleep”?
We think there is a lot of potential for this kind of simple, plain-English feedback in the quantified self area. Graphs play an important role in providing a rich way to explore data, and many quantified-self types, like myself, just like digging through data on ourselves (is there any greater vanity?). But sometimes, those high-level inferences are what we want at the end of the day.


