QS Access App Visualization Showcase
Ernesto Ramirez
October 21, 2014
Two weeks ago we announced the release of the QS Access App so you could access your HealthKit data in tabular format for personal exploration, visualization, and analysis. In that short period of time, we’ve seen a good number of downloads and positive feedback.
We know from our experiences hosting in-person and online communication about personal data that seeing real-world examples of what is possible is what inspires people to engage and ask questions of their own data. With that in mind we’re excited to announce our QS Access Visualization Showcase.
We are looking to you, our amazing community of trackers, designers, and visualizers, to show use what you can do with data gathered from using the QS Access App. Make heatmaps in D3, complete analyses and visualizations in Wizard, or just make meaningful charts in Excel. If you’re visualizing your QS Access data we want to see it.
We also know that data visualization design and creation is not trivial work. To support the community and help expose the visualization work we’ll be awarding free tickets to our QS15 Global Conference & Exposition to individuals who use QS Access to create unique and interesting visualizations. We’ve earmarked two tickets (a $700 value) for outstanding work. If you’re selected, we’ll also work with you to showcase your work at the QS15 Conference and Exposition so other community members and attendees can explore and learn from their own data.
Submit your visualizations here.
If you’re in the Bay Area come to our QS Meetup on November 11th at the Berkeley Skydeck. You can showcase your visualization and tell our community what you’ve learned from accessing and visualizing your data.
Example Visualizations
HealthKit is still new and the number of apps that integrate with it is growing by the day. At QS Labs we’ve done a bit of work making simple visualizations that are meaningful to us.
Steps and Sedentary Activity


Gary has an iPhone 5s which has native step tracking. We used the QS Access app to export his hourly step totals and made these simple line graphs in Excel. You can read more about what he learned from these simple data visualizations here.
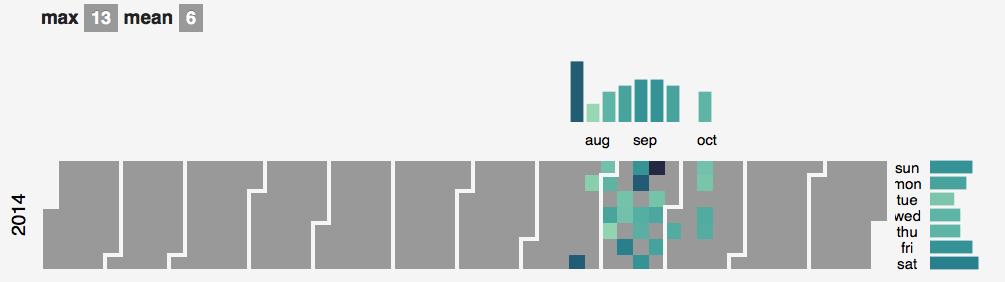
How Much Do I Run?
Ernesto is an avid runner and enjoys running along the quiet trails in Los Angeles. He was interested to see how often he actually runs and if there’s any pattern to his running. Using a well-designed D3 template he was able to make a calendar heatmatp of his running distance.
Example Data
If you don’t have any HealthKit data to work with, or just want to play with some example data we’ve created a few files that you can use as examples. Download the files below from our GitHub account and make sure to read the documentation to understand where the data is coming from. Descriptions of the data files and sources are available in our QS Access Data Examples repo on Github.
Example Data:
ER_HealthKit_DailyData
ER_HealthKit_HourlyData

