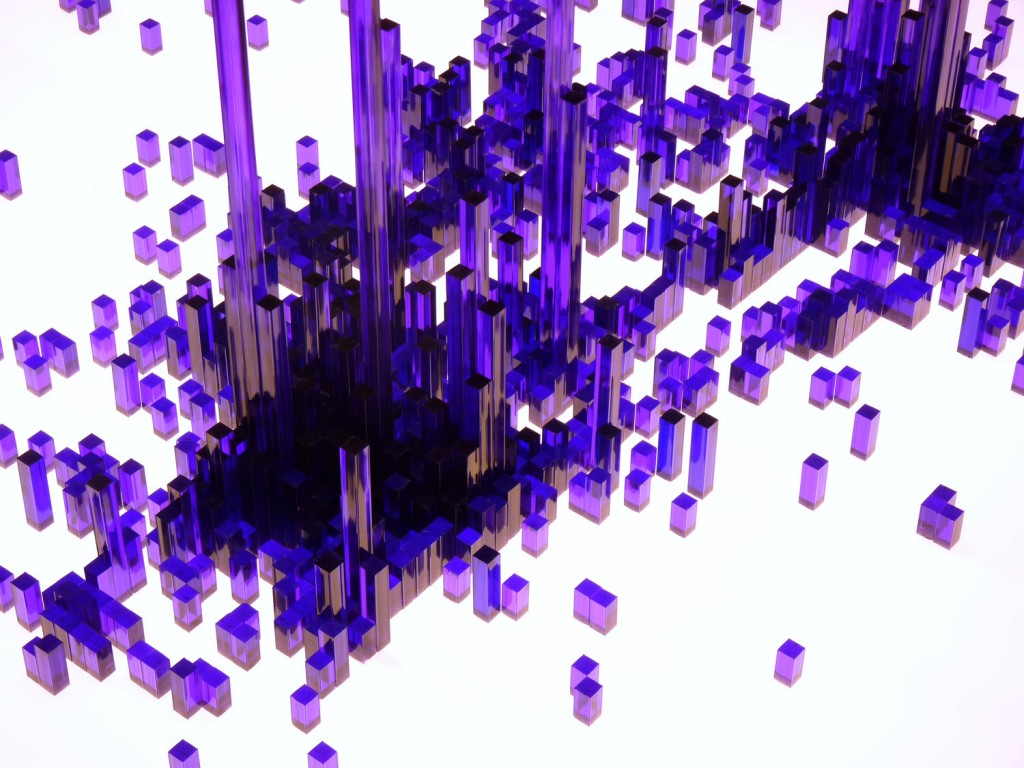
QS17 Preview: Data-Based Sculpture
Azure Grant
May 10, 2017
Stephen Cartwright: I create landscape sculptures based on data recorded over the course of several years. This summer in Amsterdam, I’ll show these images and talk about how I make them.
Sometimes the hardest part of self-tracking isn’t deciding what to track, or even being diligent about tracking. The biggest challenge can be creating captivating visualizations that deliver a message.
Stephen Cartwright is taking data visualization to a new level. He’s the associate director at the School of Art and Design at the University of Illinois at Urbana-Champaign and himself an artist who uses self-tracking to create programmable sculpture, 3D acrylic topographies, and even acoustic representations of jet-lag. At QS17, he’ll be sharing some of these fantastic sculptural representations of his data with us.
Stephen is a familiar face at QS conferences. You may have seen one of his moving sculptures at QS15 or his talk on 17 years of location tracking. His art draws inspiration from data he collects about his family’s travels, his exercise, and his interaction with the environment. The results – including moving, color changing sculptures depicting temperatures through the seasons, and animations of his family’s migration through the United States – render an incredible image of change over time.
For those of us looking for clear ways to deliver personal data or research in outside-the-bar-graph ways, Stephen is an inspiration. If you’re an artist, scientist, engineer, doctor, designer, or just interested in the future of self-tracking and how novel data visualization can be used to understand ourselves and the world around us, check out our amazing program and join us this summer in Amsterdam!


