QS Gallery: Bob Troia
Ernesto Ramirez
November 2, 2013
This entry comes to us from Bob Troia. Bob runs the excellent Quantified Bob blog where he explores self-tracking and experimentation. Make sure to check out this post where he explains how he created this great visualization of his movement data.
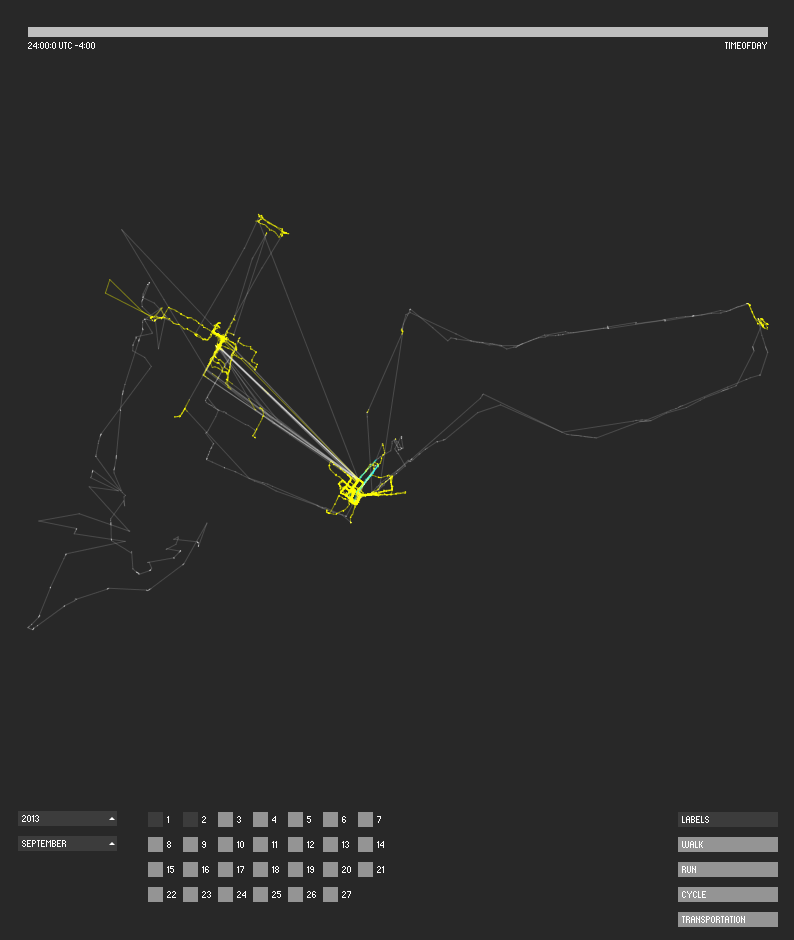
Here’s a cool visualization of approximately 1 month of my location data in and around New York City using Moves and a Processing sketch Nicholas Felton put together. Yellow lines are walking (you’ll see the hot spots where I walk my dog or around my office, blue are cycling (usually to/from the soccer field), and gray are subways/car/taxi. Pretty neat! It shows that I am very much a creature of habit (or I walk the same routes all the time to conserve willpower! 🙂
Tools: Moves; Moves Mapper
We invite you to take part in this project as we share our favorite personal data visualizations.If you’ve learned something that you are willing to share from seeing your own data in a chart or a graph, please send it along.

