QS18 Profile: Aaron Parecki and 10 Years of Location Data
Todd Woodlan
September 4, 2018
If you were to look at Aaron Parecki’s map of his hometown, there is only a slight chance you’d recognize it as Portland, Oregon. Some roads are brightly colored thick lines that stand out against a black background and others are thin, barely visible filaments that are easy to miss. There are no marked roads and no scale. It’s the last tool you’d want to use to get from point A to point B. Even so, in a different sense might be the most detailed and most personal map of Portland ever created, made from a four years of location data recorded at increments of 1-6 seconds. Aaron’s map of self-tracking data is a strong reminder that we interact with the places we live on our own terms that aren’t necessarily dictated by the roads in front of us.
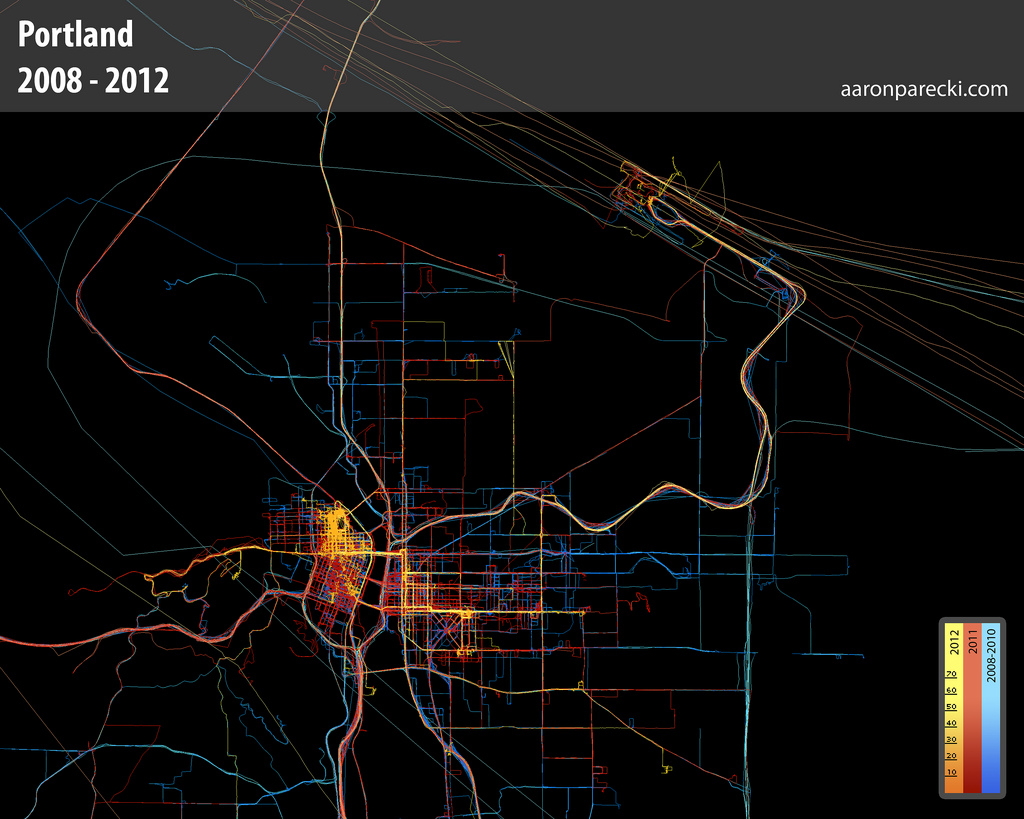
Aaron’s movement in Portland from 2008 to 2012. Aaron has continued to track his location and now has ten years of data.
The image shows Aaron’s location from 2008 to 2012, but he has continued to log this information and has recently reached the ten year mark. The tools he’s used has changed over time, but they have increasingly mirrored the deeply personal element behind the maps. Aaron’s self-designed iOS app Overland passively tracks location while the tracking server Compass stores the data, making the actual recording process unobtrusive and creating an easy platform to retroactively analyze the data. Both are open source and allow other self trackers to modify the technology to their own projects. Likewise, Aaron has developed both the app and API with the intent of individuals owning their own data. Because location tracking includes not just the physical location of a person at any point in time, but also a detailed picture of their movement habits and areas of interest, both tools include privacy controls to make sure that the user retains ownership and access to the data.
A comprehensive record of location data can easily be mapped on to mood, biological markers, or any other data recorded at the same time. With these tools, it would be possible to see how passing through a specific area of town affects mood or if a particular commute correlates with a change in weight or heart rate, giving context to metrics on how our bodies are functioning that are normally dissociated from the surrounding environment.
Aaron’s project is a good map of his own experience of Portland and the tools he uses provide a blueprint for your own location-based tracking project. He’ll be leading a workshop at the QS Conference this month, so if you want to talk about how you can apply these approaches in your own projects, you’ll have a chance to meet him there.

