QSEU14 Breakout: Mapping Data Access
Ernesto Ramirez
June 26, 2014
Today’s post comes to us from Dawn Nafus and Robin Barooah. Together they led an amazing breakout session at the 2014 Quantified Self Europe Conference on the topic of understanding and mapping data access. We have a longstanding interest in observing and communicating how data moves in and out of the self-tracking systems we use every day. That interest, and support from partners like Intel and the Robert Wood Johnson Foundation, has helped us start to explore different methods of describing how data flows. We’re grateful to Dawn and Robin for taking this important topic on at the conference, and to all the breakout attendees who contributed their thoughts and ideas. If mapping data access is of interest to you we suggest you join the conversation on the forum or get in touch with us directly.
Mapping Data Access
By Dawn Nafus and Robin Barooah
One of the great pleasures of the QS community is that there is no shortage of smart, engaged self-trackers who have plenty to say. The Mapping Data Access session was no different, but before we can tell you about what actually happened, we need to explain a little about how the session came to being.
Within QS, there has been a longstanding conversation about open data. Self-trackers have not been shy to raise complaints about closed systems! Some conversations take the form of “how can I get a download of my own data?” while other conversations ask us to imagine what could be done with more data interoperability, and clear ownership over one’s own data, so that people (and not just companies) can make use of it. One of the things we noticed about these conversations is that when they start from a notion of openness as a Generally Good Thing, they sometimes become constrained by their own generality. It becomes impossible not to imagine a big pot of data in the sky. It becomes impossible not to wonder about where the one single unifying standard is going to come from that would glue all this data together in a sensible way. If only the world looked something like this…

We don’t have a big pot of data in the sky, and yet data does, more or less, move around one way or another. If you ask where data comes from, the answer is “it depends.” Some data come to us via just a few noise-reducing hops away from the sensors from which they came, while others are shipped around through multiple services, making their provenance more difficult to track. Some points of data access come with terms and conditions attached, and others less so. The system we have looks less like a lot and more like this…
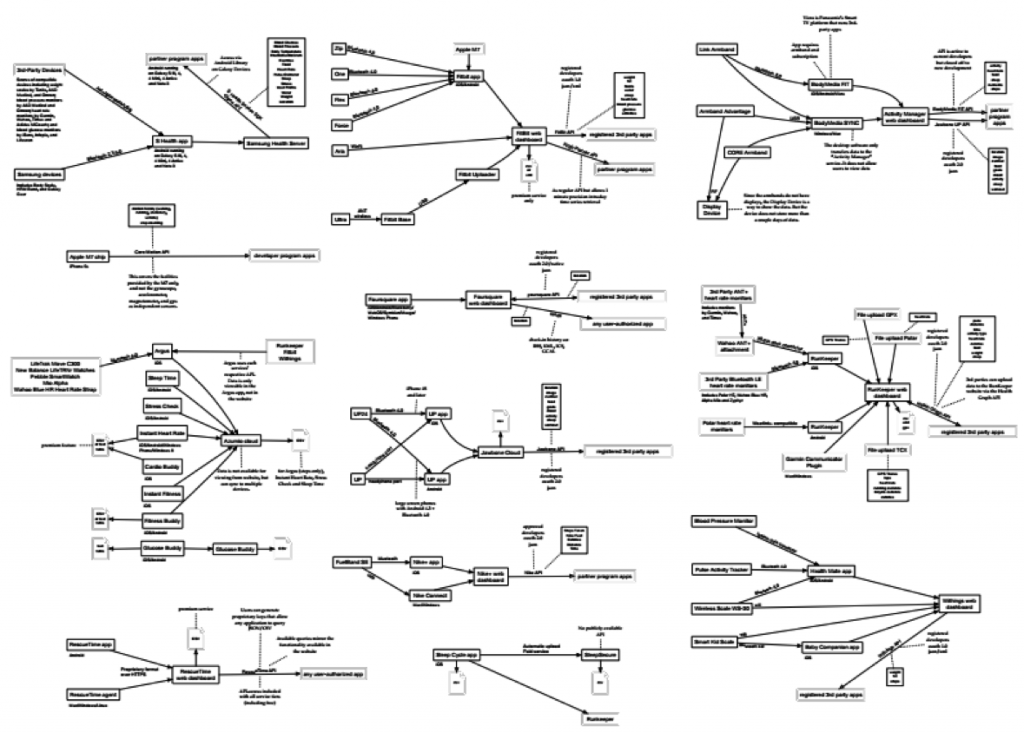
… a heterogeneous system where some things connect, but others don’t. Before the breakout session, QS Labs had already begun a project [1] to map the current system of data access through APIs and data downloads. It was an experiment to see if having a more concrete sense of where data actually comes from could help improve data flows. These maps were drawn from what information was publicly available, and our own sense of the systems that self-trackers are likely to encounter.
Any map has to make choices about what to represent and what to leave out, and this was no different. The more we pursued them, there more it became clear that one map was not going to be able to answer every single question about the data ecosystem, and that the choices about what to keep in, and what to edit out, would have to reflect how people in the community would want to use the map. Hence, the breakout session: what we wanted to know was, what questions did self-trackers and toolmakers have that could be answered with a map of data access points? Given those questions, what kind of a map should it be?
Participants in the breakout session were very clear about the questions they needed answers to. Here are some of the main issues that participants thought a mapping exercise could tackle:
Tool development: If a tool developer is planning to build an app, and that app cannot generate all the data it needs on its own, it is a non-trivial task to find out where to get what kind of data, and whether the frequency of data collection suits the purposes, whether the API is stable enough, etc.. A map can ease this process.
Making good choices as consumers: Many people thought they could use a map to better understand whether the services they currently used cohered with their own sense of ‘fair dealings.’ This took a variety of forms. Some people wanted to know the difference between what a company might be capable of knowing about them versus the data they actually get back from the service. Others wanted a map that would explicitly highlight where companies were charging for data export, or the differences between what you can get as a developer working through an API and what you can get as an end user downloading his or her own data. Others still would have the map clustered around which services are easy/difficult to get data out of at all, for the reason that (to paraphrase one participant) “you don’t want to end up in a data roach motel. People often don’t know beforehand whether they can export their own data, or even that that’s something they should care about, and then they commit to a service. Then they find they need the export function, but can’t leave.” People also wanted the ability to see clearly the business relationships in the ecosystem so they could identify the opposite of the ‘roach motel’—“I want a list of all the third party apps that rely on a particular data source, because I want to see the range of possible places it could go.”
Locating where data is processed: Many participants care deeply about the quality of the data they rely on, and need a way of interpreting the kinds of signals they are actually getting. What does the data look like when it comes off the sensor, as opposed to what you see on the service’s dashboard, as opposed to what you see when you access it through an API or export feature? Some participants have had frustrating conversations with companies about what data could fairly be treated as ‘raw’ versus where the company had cleaned it, filtered it, or even created its own metric that they found difficult to interpret without knowing what, exactly, goes into it. While some participants did indeed want a universally-applicable ‘quality assessment,’ as conveners, we would point out that ‘quality’ is never absolute—noisy data at a high sample rate can be more useful for some purposes than, say, less noisy but infrequently collected data. We interpreted the discussion to be, at minimum, a call for greater transparency in how data is processed, so that self-trackers can have a basis on which to draw their own conclusions about what it means.
Supporting policymaking: Some participants had a sense that maps which highlighted the legal terms of data access, including the privacy policies of service use, could support the analysis of how the technology industry is handling digital rights in practice, and that such an analysis could have public policy implications. Sometimes this idea didn’t take the form of a map, but rather a chart that would make the various features of the terms of service comparable. The list mentioned earlier of which devices and services rely on which other services was important not just to be able to assess the extent of data portability, but also to assess what systems represent more risk of data leaking from one company to another without the person’s knowledge or consent. As part of the breakout, the group drew their own maps—maps that either they would like to exist in the world even if they didn’t have all the details, or maps of what they thought happened to their own data. One person, who drew a map of where she thought her own data goes, commented (again, a paraphrase) “All I found on this map was question marks, as I tried to imagine how data moves from one place to the next. And each of those question marks appeared to me to be an opportunity for surveillance.”
What next for mapping?
If you are a participant, and you drew a map, it would help continue the discussion if you talked a little more about what you drew on the breakout forum page. If you would like to get involved in the effort, please do chime in on the forum, too.
Clearly, these ecosystems are liable to change more rapidly than they can be mapped. But given the decentralized nature of the current system (which many of us see as a good thing) we left the breakout with the sense that some significant social and commercial challenges could in fact be solved with a better sense of the contours and tendencies of the data ecosystem as it works in practice.
[1] This work was supported by Intel Labs and the Robert Wood Johnson Foundation. One of us (Dawn) was involved in organizing support for this work, and the other (Robin) worked on the project. We are biased accordingly.

