Quantified Homescreens
Ernesto Ramirez
February 16, 2015
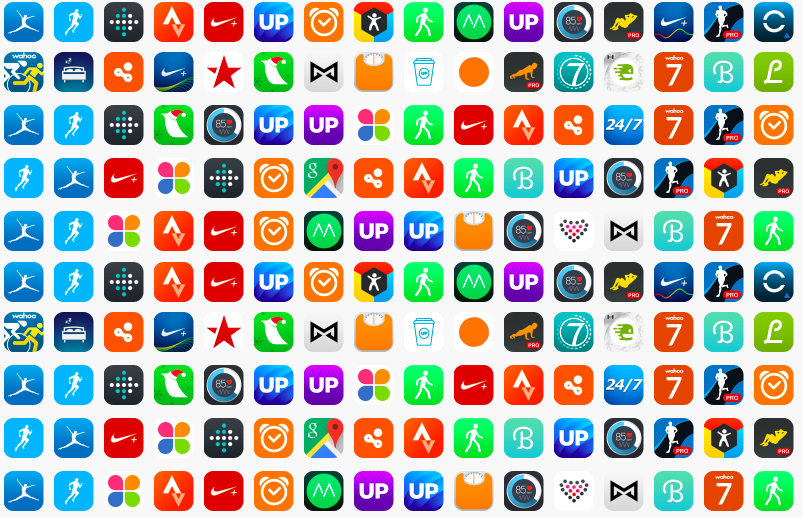
Betaworks recently announced that they had collected data from over 40,000 users who shared their iPhone homescreens through their apptly named #homescreen app. As they stated in their announcement, the apps people keep on their homescreen are often the apps they use the most. Being a data-minded individual I thought, “I wonder what kind of questions you could ask of this kind of data?” Of course, I immediately jumped to using the data to try and understand the landscape of self-tracking and quantified self app use. Let’s dive in.
Methods
I didn’t do anything fancy here. I used the search function to look up specific applications that I either use myself or have heard of. I also used the “in folders with” and “on homescreens with” lists to find additional applications that weren’t on my initial list. Each of the apps I found went into a Google Spreadsheet along with the “on % of homesceens” value reported by #homescreen. Additionally I categorized each of the apps into one of seven very broad categories: Activity, Fitness, Diet, Sleep, General Tracking, General Health, and Other.

If you search for an app this is the data that is returned.
Results
I was able identify 65 unique applications reported as being present on #homescreen users iPhone homescreens. While in no way a complete list, I think it’s a good sample to see what people are using in their everyday life. So, how does the data actually break down?
Category Representation
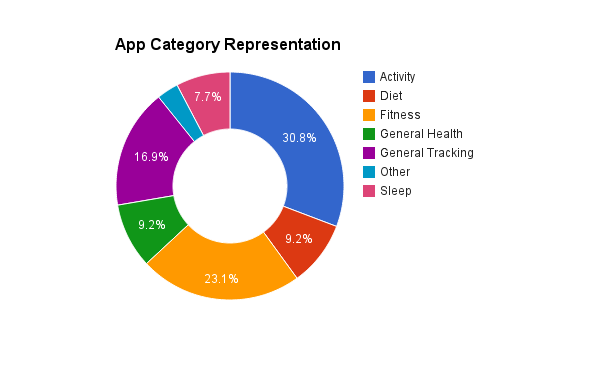 The most popular category was Activity with 20 apps (30.8%) followed by Fitness (15 / 23.1%), General Tracking (11 / 16.9%), a tie between General Health and Diet (6 / 9.2% each), Sleep (5 / 7.7%), and Other (2 / 3.1%).
Frequency of Homescreen Appearance
Perhaps unsurprisingly, Apple’s Health app tops the list here with a whoping 23.45%. No other self-tracking application even comes close to that level of homescreen penetration. The next most frequent application is Day One (a journaling app) with 8.45%.

Clearly Apple Health skews the data so let’s look at homescreen frequency without it in the data set:

When you exclude Apple Health (a clear outlier) the average percentage for homescreen frequency is 0.83% with a standard deviation of 1.39%. This data is skewed by a high number of applications that appear very infrequently. How skewed?

If we disregard all apps that fall below this 1% cutoff what do we find? Fourteen apps meet this criteria: Coach.me, Day One, Fitbit, Health Mate (Withings), Moves, MyFitnessPal, Nike+, Pedometer++, Runkeeper, Runtastic Pro, Sleep Better, Sleep Cycle, Strava, and UP (Jawbone):

Interestingly, MyFitnessPal is the only “Diet” app that made this >1% list, but it has the second highest appearance percentage at 4.36. Sleep Cycle is not far behind at 3.98%.
Discussion
Let’s start with the caveats. Obviously you can’t take these simple findings and generalize it to all individuals with smartphone, especially because this is only capturing iPhone users (many of the apps in this list have Android versions as well). Second, this data is based on a relatively small sample size of 40,000 individuals that are using the #homescreen app. Third, users of #homescreen are probably not representative of the general population of self-tracking application users. Lastly, it’s hard to draw conclusions about actual app use from this data. Like many people (myself included), I’m sure this data set has more than a few users who don’t regularly change their homescreen configuration when apps fall out of favor.
With that out of the way, what did I actually find interesting in this data set?
I found that sleep tracking, or having sleep tracking apps on a homescreen, was more popular than I thought it would be. Of the top 15 apps, 2 were sleep. When exploring by category, sleep had the highest mean appearance percentage (when also excluding Apple Health) at 1.32% (n = 5 apps).
For connected tracking devices, Fitbit (3.47%) is the clear winner, far outpacing it’s wearable rivals. The next closest application that is at least partially dedicated to syncing with a wearable device was Health Mate by Withings (2.14%).
I was reluctant to include Day One in this analysis. It isn’t commonly thought of as a “self-tracking” or “quantified self” application, but journaling and daily diaries are a valid form of tracking a life. Clearly it resonates with the people in this data set.
This was a fun exercise, but I’m sure there are many more questions that can be answered with this data set. I’ve compiled everything in an open google spreadsheet. I’ve enabled editing in the spreadsheet so feel free to add apps I might have missed or create additional charts and analysis.
And in the spirit of full disclosure, he’s my current homescreen.
This post first appeared on our Medium publication “Notes on Numbers, where we’re starting to share some of our thoughts and editorial experiments. Follow along with us there.

