What We Are Reading
Ernesto Ramirez
June 8, 2014
A bit of a change this week. Today we’re posting some of our favorite academic and scholarly articles dealing with many different aspects of Quantified Self tools and methods. If that’s not for you, make sure to scroll down for some great self -tracking projects and visualizations. (Make sure to click [pdf] for the full article.)
Articles
Understanding Physical Activity through 3D Printed Material Artifacts [pdf] by Rohit Khot, Larissa Hjorth, and Florian Mueller. A fascinating paper on what happens when you transform digital physical activity data into representative physical objects.
Personal Tracking as Lived Informatics [pdf] by John Rooksby, Mattias Rost, Alistair Morrison and Matthew Chalmers. The authors of this research paper interviewed users of self-tracking tools to better understand how they incorporate personal data into their lives. From the abstract, “We suggest there will be difficulties in personal informatics if we ignore the way that personal tracking is enmeshed with everyday life and people’s outlook on their future.”
Persuasive Technology in the Real World: A Study of Long-term Use of Activity Sensing Devices for Fitness [pdf] by Thomas Fritz , Elaine M. Huang, Gail C. Murphy and Thomas Zimmermann. The authors of this study interviewed thirty individuals who had been using different activity tracking tools for different amounts of time (3-54 months). Those interviews unearthed some of the reasons why people starting using and continue to find activity trackers useful in their lives.
Using MapMyFitness to Place Physical Activity into Neighborhood Context by Jana Hirsch, Peter James, Jamaica Robinson et al. What can you find out about a population by partnering with a QS toolmaker? Jana Hirsch and colleagues tried to answer that question by partnering with MapMyFitness to better understand where and how individuals in Winston-Salem, North Carolina were exercising.
Visualized and Interacted Life: Personal Analytics and Engagement With Data Doubles [pdf] by Minna Ruckentstein. Don’t let the the title fool you, this article is not about new analytical methods for personal data. Rather, it is an thorough examination of the phenomenology of self-tracking and how people construct understanding of themselves through personal data collection.
Show&Tell
Stress Trigger Personal Survey by Paul LaFontaine. We were lucky to hear about Paul’s stress tracking at the 2014 QS Europe Conference. While we work on getting that talk edited and posted online we thought this would be a great sneak preview.
Data, Pictures, and Progress by Chris Angel. Chris found out about QS while he was thinking about figuring out how to best lose weight. This post is his “first quarter” report from 2014.
Google has most of my email because if has all of yours by Benjamin Mako Hill. Benjamin has been running his own email server for 15 years. After a conversation with a friend he began wondering about how much email Google has a copy of. What followed was an amazingly in-depth analysis.
Visualizations
 30 Examples of the Art of Mapping Personal Habits. Some amazing examples of visualizations based on self-collected data in this post by Visualoop.com.
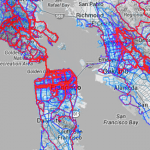
 Strava Labs Global Heatmap. You can explore over 220 billion data points from almost 100 million different running and cycling activities tracked with the Strava app. (If you’re interested in the engineering side of this visualization they’ve written a great blog post here.)
From the Forum
iPhone Equivalent of Android’s TapLog?
Method for Tracking “As Needed” Medications?
Want to receive the weekly What We Are Reading posts in your inbox? We’ve set up a simple newsletter just for you. Click here to subscribe.


