What We Are Reading
Ernesto Ramirez
June 15, 2014
We’re back with another great set of articles, show&tells, and visualizations for you.
Articles
How to Make Government Data Sites Better by Nathan Yau. Government entities are some of the largest holders of interesting data. Nathan focuses this article on the difficulties of accessing and making sense of data from the United States Centers for Disease Control and offers some good ideas on how to make it better.
Project Eavesdrop: An Experiment At Monitoring My Home Office by Steve Henn. What happens when you start monitoring yourself in the same manner the NSA might be doing? The author employs some technical help to learn what data leaks are possible and what you can figure out from your digital trails.
Sitting is Bad for You. So I Stopped. For a Whole Month. by Dan Kols. As a past frequent user of a treadmill desk and a sedentary behavior researcher I found this article intriguing. Yes, a bit silly in nature, but an interesting look at what happens when you go to the extreme. I especially enjoyed the integration of personal tracking in the piece.
The Future of Biosensing Wearables by Rock Health. Our friends at Rock Health did some great research on where personal sensing is going.
Show&Tell
Analyzing Squash Performance Using Fitbit by Ben Sidders. Ben sought out to see if he could learn anything from his step data to improve his squash playing. In this post he explains how he used R to access his data and plot it against his squash records, which he also records.
My Life As Seen Through Fitbit. Reddit user, VisionsofStigma, plots a year and a half of Fitbit data to find out what is related to the rise and fall of his activity.
Visualizations
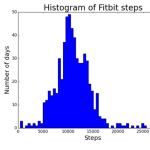 Freeing My Fitbit Data by Bonnie Barrilleaux. Bonnie used our instructions for accessing Fitbit data in Google Spreadsheets then used Python to visualize her data. I especially like the histogram pictured at left. If you want to visualize your Fitbit data, she’s included her code in the post.
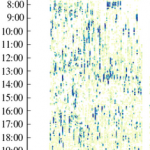 Diurnal Plot of Fitbit Data by Matthew Gaudet. Matthew was inspired by the diurnal plots from Stephen Wolfram’s in-depth personal data review. He implemented the same methods to better understand his activity.
 Iconic History by Shan Huang. As part of a the Interactive and Computational Design class at Carnegie Mellon University, Shan created a Chrome browser extension that visualizes your browser history. More about the project here.
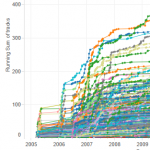 Visualizing Last.fm History by Andy Cotgreave. Andy has been using Last.fm since 2006 to track his music listening activity. As a data scientist he was interested in what he could learned from all that data. In this four-part series, he explores his data along side data from eight of his friends. (If you want explore your Last.fm data you can export it using this awesome CSV export tool.)
From the Forum
23andMe Data Analysis Tools
Just Want To Track Hours in Bed
Want to receive the weekly What We Are Reading posts in your inbox? We’ve set up a simple newsletter just for you. Click here to subscribe.

