What We Are Reading
Ernesto Ramirez
July 5, 2014
We’ve assembled another great list of articles, posts, and other interesting ideas for you to enjoy.
Articles
Billy Beane’s Ascendant A’s Are Playing a Brand-New Brand of Moneyball by Will Leitch. I know what you’re thinking, “What’s an article about baseball doing in this list?” First, it’s about how the Oakland Athletics are using metrics to improve their team. And two, I was struck by the following:
“Instead, Beane and his front office have bought in bulk: They’ve brought in as many guys as possible and seen who performed. They weren’t looking for something that no one else saw: They amassed bodies, pitted them against one another, were open to anything, and just looked to see who emerged. Roger Ebert once wrote that the muse visits during the act of creation, rather than before. The A’s have made it a philosophy to just try out as many people as possible—cheap, interchangeable ones—and pluck out the best.”
Sounds a lot like our old friend, Seth Roberts, describing the value of self-experimentation – start small, do a lot of them, learn by doing.
Build Great Models . . . Throw Them Away by Mark Ravina. A digital humanities researcher makes the case for using data and statistical methods of modeling not to answer questions, but to come up with better questions. Really enjoyed the great examples in this post.
App data reveals locations, times and distances of Calgary’s runners and cyclists by Meghan Jessiman. A collaboration between RunKeeper and the local Calgary Herald newspaper led to some interesting findings and, of course, some activity heat maps.
A Digital Dose of Magic Medicine by Naveen Rao. Naveen connects the dots between the recent controversy surrounding Doctor Oz to the possibly misplaced hopes we’re putting in tools like HealthKit.
9-Volt Nirvana by RadioLab. This episode of the always interesting RadioLab tells the story of a journalist who was hooked up to a tDCS device for a sniper shooting exercise. The device helped her accuracy in the simulation, but then there was an unexpected after-effect. For three days afterward, the voices of self-doubt and self-abnegation receded from her consciousness. She talks about that experience directly on her blog. (Thanks to Steven Jonas for sending this one in!)
Tracking Sleep With Your Phone by Belle Beth Cooper. A great roundup here of iOS and Android apps you can use to track sleep. I especially appreciated the nice discussion of the current limitations of using mobile apps to track and understand sleep.
From Missiles To The Pitch: The Story Behind World Cup Tech by Melissa Block and NPR. If you’re wondering how FIFA is able to track the movement of individuals players during this year’s World Cup then this is for you. You can also check out all the data on FIFA’s website here.
Show&Tell
Productivity, the Quantified Self and Getting an Office by Bob Tabor. Bob works at home and was curious about how productive he really was. After using RescueTime he realized maybe he wasn’t getting the productive time he really need.
Basis to Roambi by Florian Lissot. Florian wanted to explore his Basis data. After using Bob Troia’s great data access script and some additional tools to aggregate multiple files he was able to create some great visualizations with Roambi and learn a bit more about his daily patterns of activity.
Do you have a self-tracking story you want to share? Submit it now!
Visualizations
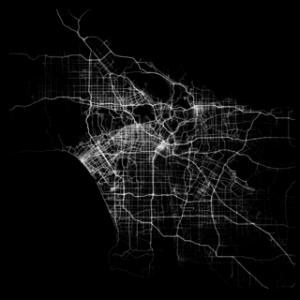
How We Move in Cities by Human.co. It seems that making heatmaps based on movement is all the rage these days. Human has gone one step further than previous entries in this category by including motorized travel alongside cycling, walking, and running data. Don’t forget to check out the amazing GIFs as well.
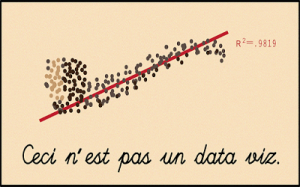
This is Not a Data Visualization by Michael Thompson.
“[…] visualizations are not the data. The data is not the sum of the experience. We’ve been inappropriately using data visualizations as the basis for statements and conclusions. We’re leaving out rigorous statistical analysis, and appropriate qualifiers such as confidence intervals. It’s exciting that we’ve become more and more a society of pattern-seekers. But it’s important that we don’t become lazy and cavalier with what we do with those observations.”
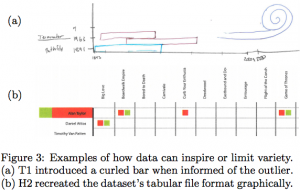
Reflections on How Designers Design With Data [PDF] by Alex Bigelow, Steven Drucker, Danyel Fisher, and Miriah Meyer. Researchers from Microsoft and the University of Utah sought out to understand how designers go the process of understanding data and creating unique visualizations.
Do you have a QS data visualization you want to share? Submit it now!
From the Forum
Best passive GPS Logger?
Quantified Baby
Android App for Self Surveys
Want to receive the weekly What We Are Reading posts in your inbox? We’ve set up a simple newsletter just for you. Click here to subscribe.

