What We Are Reading
Ernesto Ramirez
September 6, 2014
We hope you enjoy this week’s list!
Articles
Are Google making money from your exercise data?: Exercise activity as digital labour by Christopher Till. Christopher describes his recent paper, Exercise as Labour: Quantified Self and the Transformation of Exercise into Labour, which lays out a compelling argument for considering what happens when all of our exercise and activity data become comparable. Are we destined to become laborers producing an expanding commercialization of our physical activities and the data they produce?
How Big is the Human Genome? by Reid J. Robinson. Prompted by a recent conversation at QS Labs, I went looking for information about the size of the human genome. This post was one of the most clear descriptions I was able to find.
Show&Tell

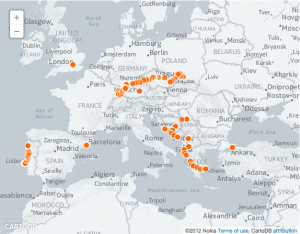
Visualizing Summer Travels by Geoff Boeing. A mix of Show&Tell and visualization here. Geoff is a graduate student and as part of his current studies he’s exploring mapping and visualization techniques. If you’re interested in mapping your personal GPS data, especially OpenPaths data, Geoff has posted a variety of tutorials you can use.
Visualizations

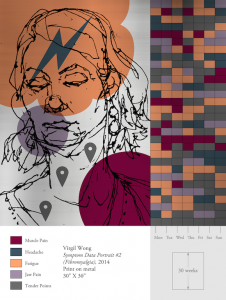
Symptom Portraits by Virgil Wong. For 30 weeks Virgil met with patients and helped them turn their symptoms into piece of art work and data visualization.
Data Visualization Rules, 1915 by Ben Schmidt. In 1915, the US Bureau of the Census published a set of rules for graphic presentation. A great find by Ben here.
From the Forum
Moodprint
Measuring Cognitive Performance
Looking Forward to Experimenting


