What We Are Reading
Ernesto Ramirez
November 15, 2014
We hope you enjoy this week’s list of articles, posts, show&tell descriptions, and visualizations!
Articles
I’m Terrified of My New TV: Why I’m Scared to Turn This Thing On — And You’d Be, Too by Michael Price. Michael, a lawyer at the Brennan Center for Justice at the NYU School of Law, describes his experiences with his new “smart” TV. More sensors means more records being stored somewhere you might not have access to. Especially interesting when your device picks up every word you say:
“But the service comes with a rather ominous warning: ‘Please be aware that if your spoken words include personal or other sensitive information, that information will be among the data captured and transmitted to a third party.’ Got that? Don’t say personal or sensitive stuff in front of the TV.”
Public Perceptions of Privacy and Security in the Post-Snowden Era by Mary Madden. A great report from the Pew Research Internet Project. I don’t want to give away any of the juicy stats so head over and read the executive summary.
This Is What Happens When Scientists Go Surfing by Nate Hoppes. It’s not all privacy talk this week. This is a fun article exploring how new sensors and systems are being used to monitor surfers as they train and practice.
How Private Data is Helping Cities Build Better Bike Routes by Shaun Courtney. We covered the new wave of personal data systems and tools feeding data back into public institutions a bit before. Interesting to hear that more cities are investing in understanding their citizens through the data they’re already collecting.
What Do Metrics Want? How Quantification Prescribes Social Interaction on Facebook by Benjamin Grosser. Ben is most commonly known around the QS community as the man behind the Facebook Demetricator, a tool to strip numbers from the Facebook user interface. In this article, published in Computational Culture, he lays out an interesting argument for how Facebook has created a system in which the users, “reimagine both self and friendship in quantitative terms, and situates them within a graphopticon, a self-induced audit of metricated social performance where the many watch the metrics of the many.”
Show&Tell
The Cubicle Gym by Gregory Ferenstein. Gregory was overweight, overworked, and in pain. He started a series of experiments to improve his help, productivity, and wellbeing. I enjoyed his mention of using the Quantified Mind website to track cognition. If you find his experience interesting make sure to read a previous piece where he explains what happened when he replaced coffee with exercise.
Maximizing Sleep with Plotly and Sleep Cycle by Instructables user make_it_or_leave_it. A really nice step by step process and example here of graphing an making sense of Sleep Cycle data.
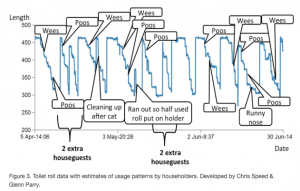 Toilet Matters by Chris Speed. A super interesting post on what a family was able to learn by having access to data on of all things, the amount of toilet paper left on a roll and when it was being used. Don’t forget to read all the way to end so you can get to gems like this:
“[…]the important note is that the source of this data is not only personal to me, it is also owned by me. We built the toilet roll holder and I own the data. There are very few products or smart phone apps that I can say the same about. Usually I find myself agreeing to all manner of data agreements in order to get the ‘free’ software that is on offer. The toilet roll holder is then my first experience of producing data that I own and that I have the potential to begin to trade with.“
Visualizations
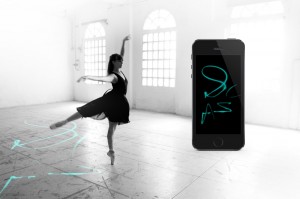 E-Traces by Lesia Trubat. A beautiful and fun project by recently graduated design student, Lesia Trubat. Using adruinos and sensors places on the shoes of dances she was able to create unique visualizations of dance movement. Be sure to watch the video here.
 Animated Abstractions of Human Data by James E. Pricer. James is an artist working on exposing self-collected data in new and interesting ways. Click through to see a dozen videos based on different types of data. The image above is a capture from a video based on genotypes derived from a 23anMe dataset.
The Great Wave of Kanagawa by Manuel Lima. Although this is an essay I’m placing it here in the visualization section because of it’s importance for those working on the design and delivery of data visualizations. Manuel uses the Great Wave off Kanagawa as a wonderful metaphor for designing how we visually experience data.
D3 Deconstructor by UC Berkeley VisLab. A really neat tool here for extracting and repurposing the data powering at D3.js based visualization.
From the Forum
myStress
Diagnosed sleep apnea. Looking for metrics pre/post treatment
Trend Research
New Self Quantifier
Memosee

