What We Are Reading
Ernesto Ramirez
January 24, 2015
Below you’ll find this week’s selection of interesting bits and pieces from around the web. Enjoy!
Articles
Open Books: The E-Reader Reads You by Rob Horning. A fantastic essay about the nature of delight and discovery, and how that may (is) changing due to data collected from e-readers. For those interested in books and data this article By Buzzfeed’s Joseph Bernstein is also an interesting read.
Flashing lights in the quantified self-city-nation by Matthew W. Wilson. Quantified Self, smart cities, and Kanye West quotes – this commentary in the Regional Studies, Regional Science journal has it all. Read closely, especially the final paragraph, which gives space to think about the role the institutions and companies that provide cities with the means to “be smart” have in our in social and urban spaces.
Most Wearable Technology Has Been a Commercial Failure, Says Historian by Madeleine Monson-Rosen. This is a interesting book review for Susan Elizabeth Ryan’s Garments of Paradise which had me thinking about the nature of wearables, customization, and expression.
‘The Cloud’ and Other Dangerous Metaphors by Tim Hwang and Karen Levy. This was mentioned so many times over the last few days by so many smart friends and colleagues that I had to set aside time to read it. It was time well spent. The authors make the case that how we talk about data (personal, public, mechanical, and bioligical) is tied to the metaphors we use, and how those metaphors can either help or hinder the broader ethical and cultural questions we find ourselves grappling with.
Why the Internet Should Be a Public Resource by Philip N. Howard. This isn’t the first, nor will it be the last, argument for changing the way we think about and regulate the Internet. Worth reading the whole things, but in case you don’t consider this point:
And then we might even imagine an internet of things as a public resource that donates data flows, processing time, and bandwidth to non-profits, churches, civic groups, public health experts, academics, and communities in need.
Computers Are Learning How To Treat Illnesses By Playing Poker And Atari by Oliver Roeder. How does research into algorithms and AI intended for winning poker games morph into something that can optimize insulin treatment? An interesting exploration on the background and future implications of computers that can learn how to play games.
Data Stories #45 With Nicholas Felton. by Enrico Bertini and Moritz Stefaner. In this episode of the great Data Stories podcast Nicholas Felton talks about his background, his interest in typography, and what led him to start producing personal annual reports. Super fun to listen to them geek out about the tools Nicholas uses to track himself.
Increasingly, people are tracking their every move by Mark Mann. A great peak into some of our QS Toronto community members and how they use self-tracking.
Quantified Existentialism by Ernesto Ramirez. I’m putting this last here because it feels a bit self-congratulatory. Earlier this week I took some time to examine how common it is for people to express their relationship with what counts when they use self-tracking tools. It was a fun exercise.
Show&Tell
Insights From User Generated Heart Rate Variability Data by Marco Altini. While not a personal show&tell (however, I’m sure his data is in there somewhere), this great post details what Marco was able to learn about HRV based on 230 users and 13,758 recordings of HRV.
Quantify This Thursday: No Coding Required by Kerri MacKay. A bit different post here, more of a how-to, but I found it really compelling the lengths Kerri went to get get her Fitbit data to show up on he Pebble watch. I was especially drawn to her explanation of why this method is important to her:
The reality is, getting nudges every time I look at the clock or dismiss a text notification on my Pebble (via my step count) is yet another way to make the wearing-a-wearable less passive and the data meaningful.
Correlating Weight with Blood Pressure by Sam. A short and simple post detailing how Sam used Zenobase and his iHealth devices to see how weight loss was associated with his blood pressure.
Visualizations

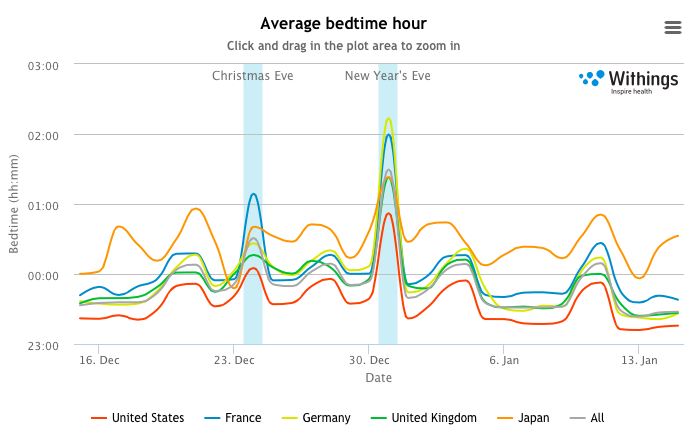
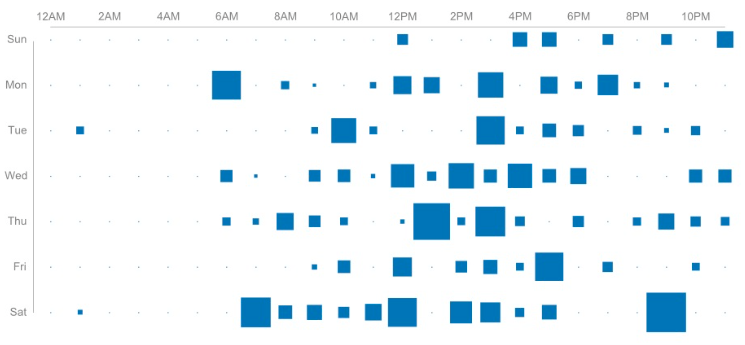
The Effect of End of Year Festivities on Health Habits by Withings. The above is just one of four great visualizations from Withings exploring how the holidays affect how users sleep, move, and weight themselves. Unsurprisingly people are less likely to weight themselves on Christmas day (I looked at my data, I am among those non-weighers).

Simon Buechi: In Pure Data by Simon Buechi. A simple, elegant dashboard intended to represent himself to the world.

Grad School Coding Analysis by Matt Yancey. The above is just a preview of two fantastic visualizations that summarize the coding Matt did while enrolled in the Northewestern Masters of Analytics program.

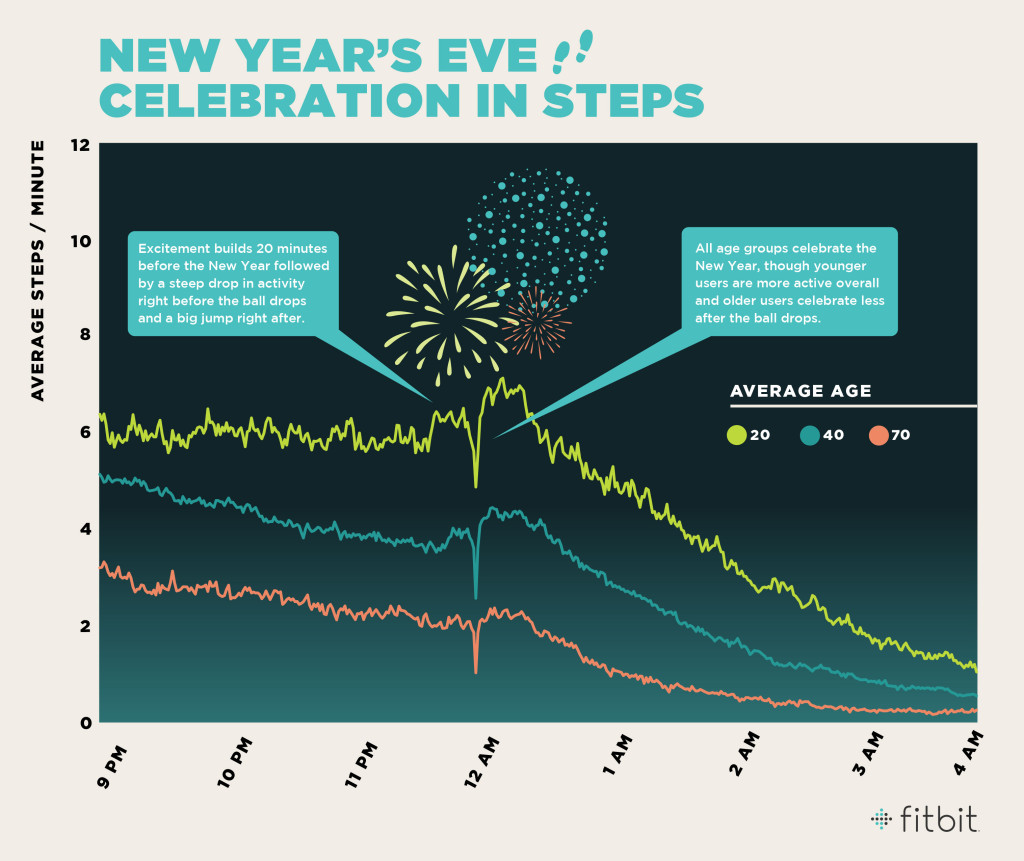
News Year’s Eve Celebration in Steps by Lenna K./Fitbit. A fun visualization describing differences in how people in different age groups moved while celebrating the new year.
From The Forum
How do I visualize information quickly? (mobile app)
Monitoring Daily Emotions
Best Heartrate Monitor that syncs with Withings Ecosystem
Is the BodyMedia Fit still alive?
Capture Online Activities (and More) into Day One Journal Software (Mac/iOS)


