What We Are Reading
Ernesto Ramirez
August 1, 2015
A long list for this week’s What We’re Reading. I actually had to stop myself from adding in even more visualizations and show&tell examples! We’re always on the lookout for more though, so make sure tweet us your favorite links!
Articles
Fitted by Moira Weigel. A very thoughtful essay on gender, identity, and confession – all while using the Fitbit as the narrative backdrop.
What kind of love does the FitBit prepare us to feel? Is it self-love? Or is even the self of the exorexic a kind of body armor?
How to Build a Smart Home Sensor by Dave Prochnow. If you have 2 hours, $95, and know how to solder, then you too can build this DIY sensor to measure the temperature, humidity, light, and noise for any room in your home. If someone builds and tests this please let me know (Would love to see air quality sensors included too!)
It’s Hard to Count Calories, Even for Researchers by Margot Sanger-Katz. New research shows Americans are eating less, but can we really trust the data? Margot does an excellent job here of rounding up the various ways we measure food consumption in the United States while coming to a commonly heard conclusion – food tracking is just plain hard.
Hadley Wickham, the Man Who Revolutionized R by Dan Kopf. If you’re knee deep in data analysis, or just like poking around in stats software, you’ve probably heard of and used R. And if you’ve used R, then there is a good chance you’ve used many of the packages written by Hadley Wickham. Great read, if for nothing else you learn what the “gg” in ggplot2 stands for.
Heart patient: Apple Watch got me in and out of hospital fast by Neil Versel. When Ken Robson wasn’t feeling well he turned to his Apple Watch. After noticing lower than normal heart rate readings his checked himself into the emergency room and soon found out his hunch was right, he had sick sinus syndrome.
New Australian experiment rewards joggers with 3D printed chocolate treats based on exercise data by Simon Cosimo. Sign me up!
Show&Tell
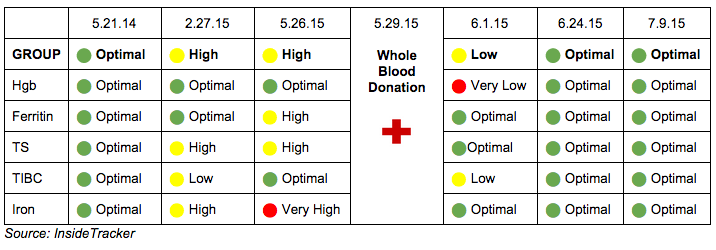
 How Does Giving Blood Affect Your Iron Levels? by Ryan W. Cohen. Simple and to the point blog post by Ryan explaining how he discovered elevated iron levels in his blood, and the simple test he tried to find out why.
The Quantified Athlete by Matt Paré. Matt is a minor league catcher in the San Francisco Giants organization. In this post, the second in a series (read Part 1 here), Matt discusses how he became interested in tracking his biomarkers, and what he’s experimenting with.
What I Learned When I Stopped Wearing a Fitbit After Seven Years by Michael Wood. Michael writes up a brief post on how he felt when he was separated from his Fitbit activity tracker.
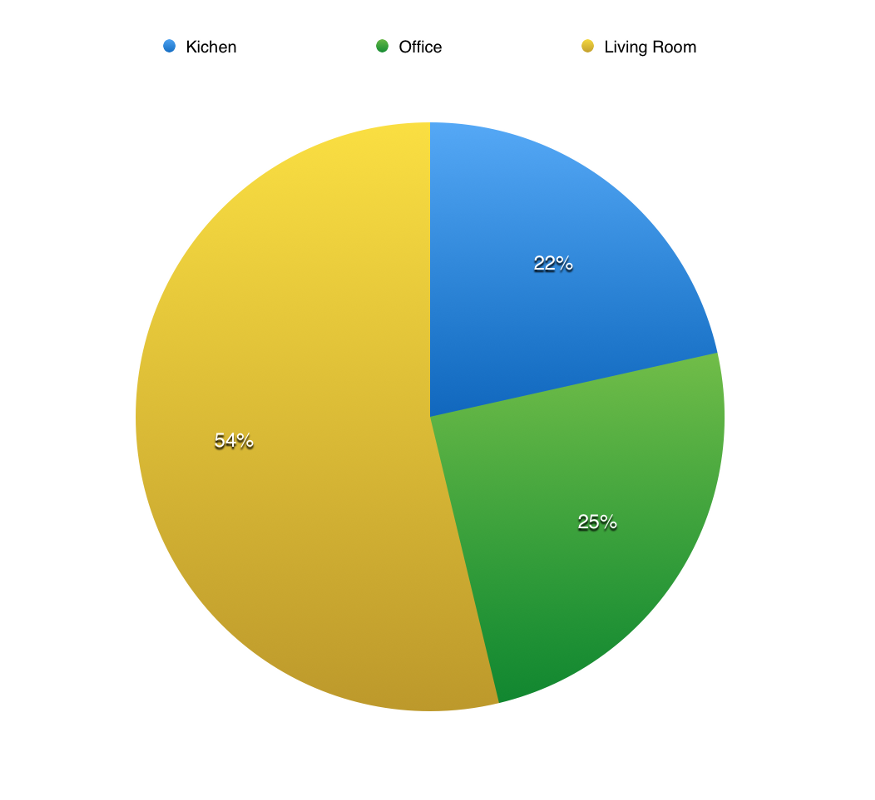
 How I tracked my house movements using iBeacons by Joe Johnston. Joe uses a few iBeacons to find out where he spend time in his house. Fascinating idea, makes me want to play with this technology as well!
Visualizations
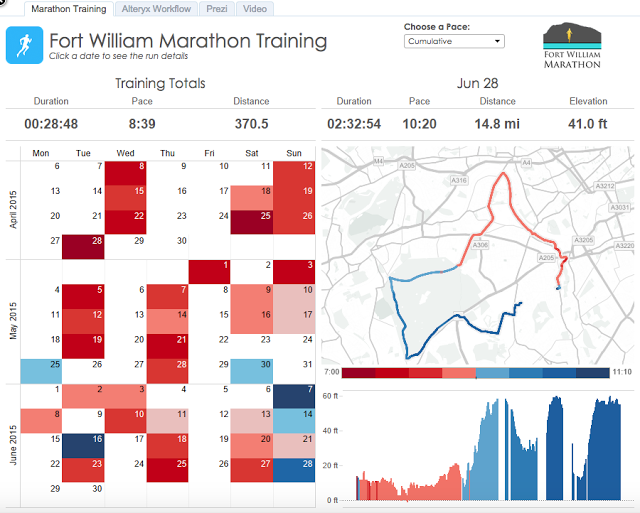
 Visualizing a Simpler RunKeeper Training Plan by Andy Kriebel. Andy presented his running data, and how he uses a few tools to keep track and visualize his data as he trains for a marathon. Follow the link and you can see his Tableu workbook, which includes a screencast of his presentation, and links to his workflow.
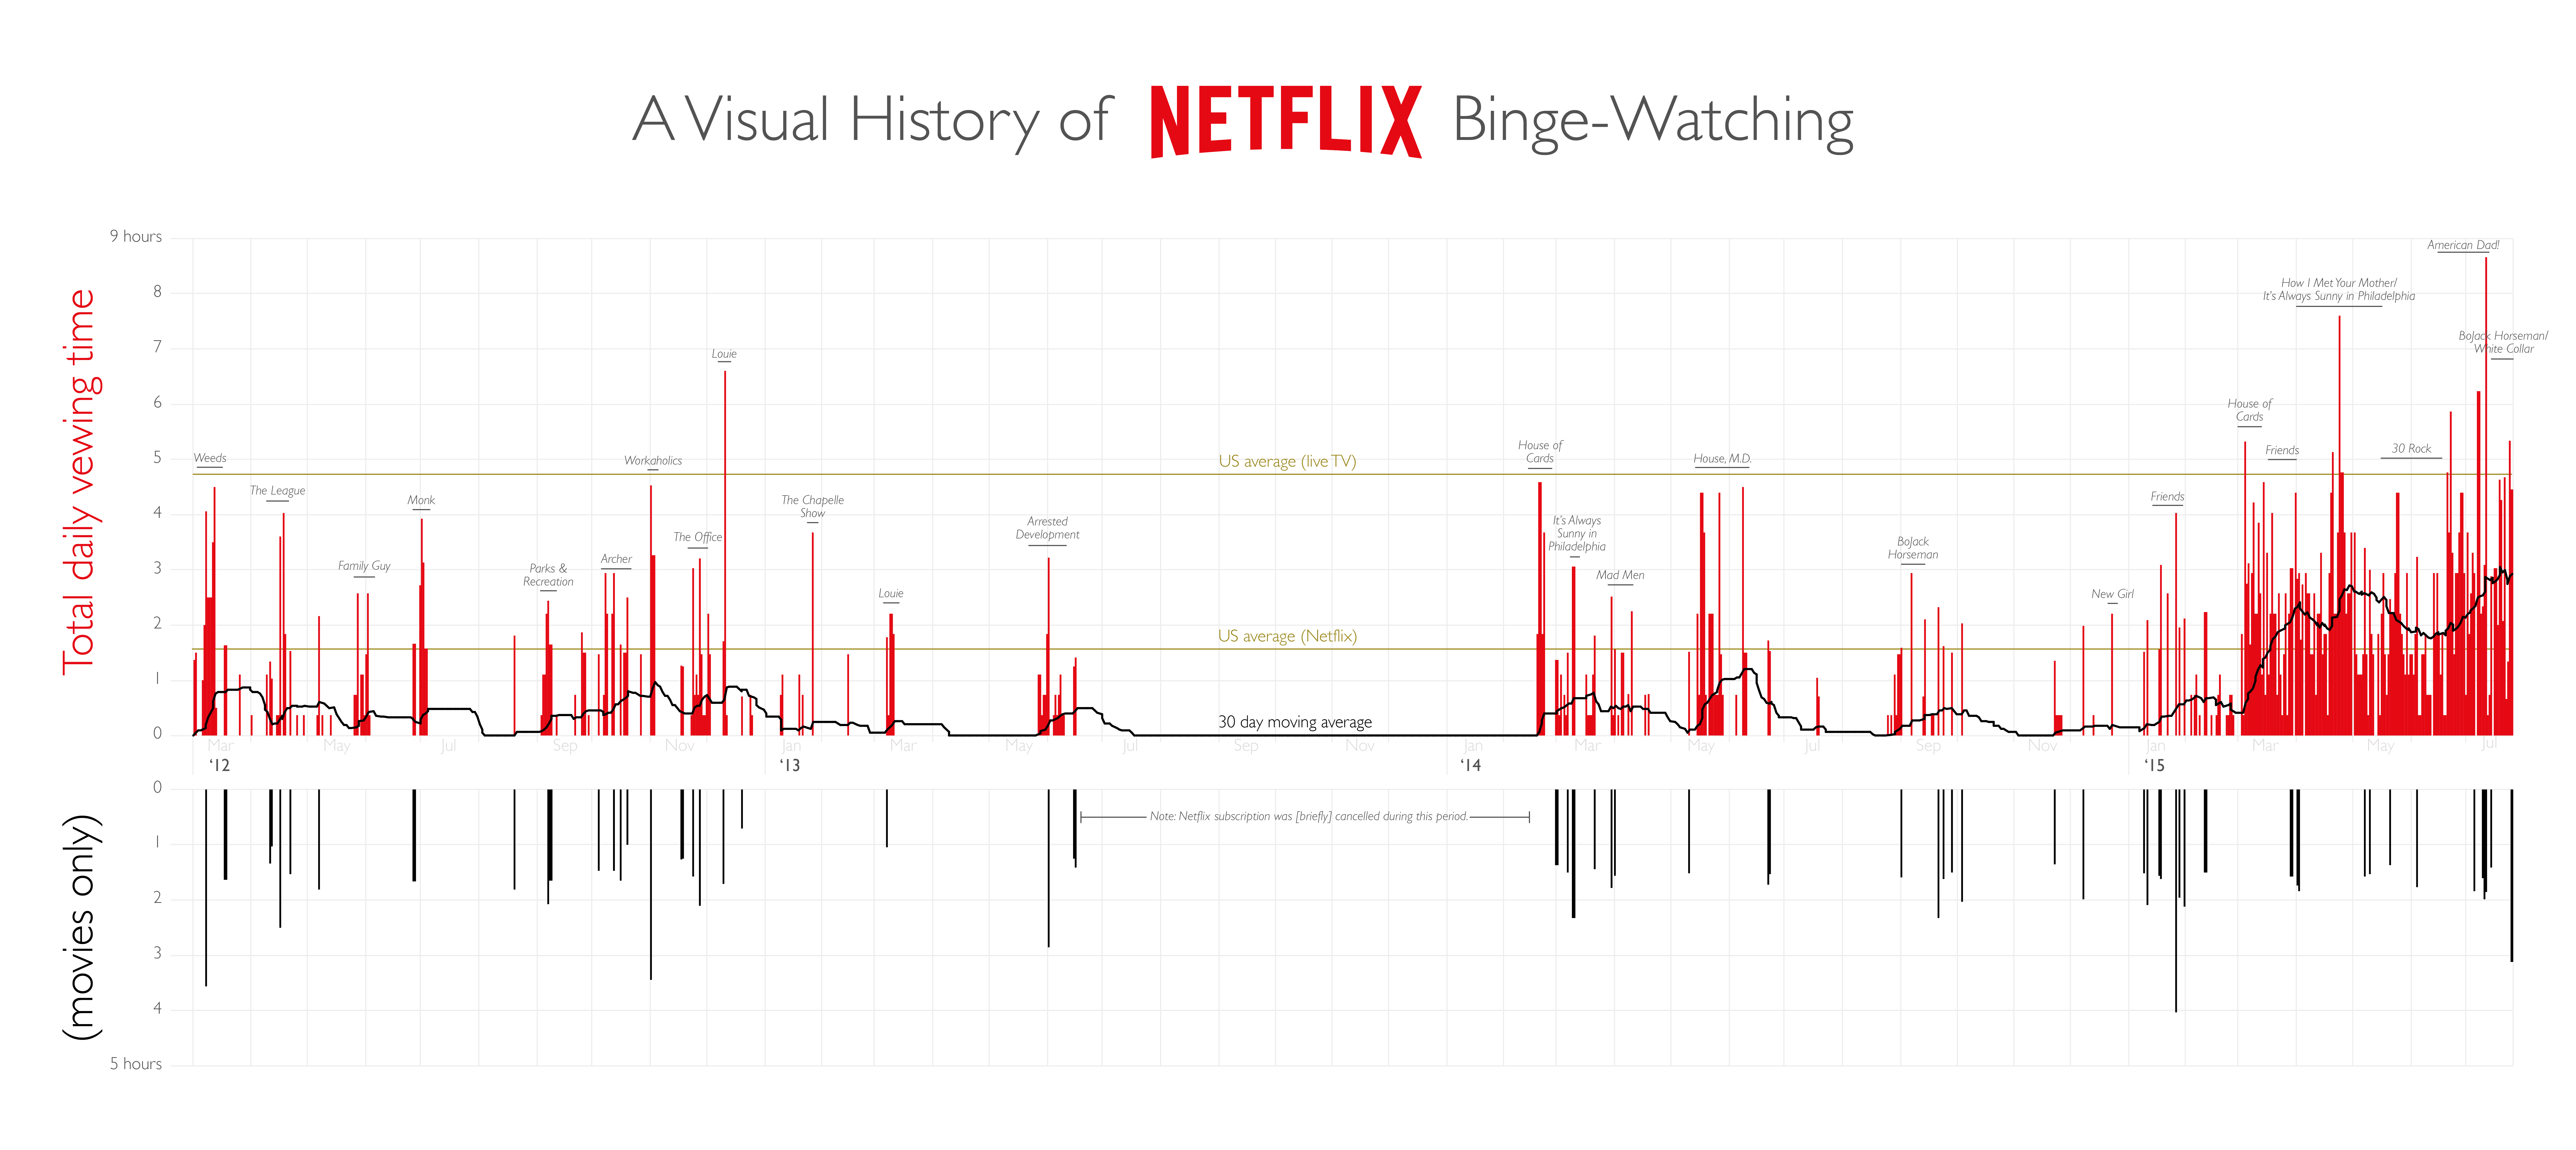
 I decided to take a peek at my Netflix viewing data by Reddit user AmericanPicker69. This enterprising individual decided to take a peak into his user account to understand his Netflix viewing habits. Turns our a simple copy/past is all you need to do to get the raw data. Who knew?!
 My weight loss journey by Reddit user IMovedYourCheese. Loved this graph and the implementation of BMI categories, a moving average, and lower/upper bounds for weight loss. He even provided the excel template if you’d like to use it with your own weight tracking.
From the Forum
Teach Arduino from Beginner to Making a Quantified Monitor
Google Fit


