What We Are Reading
Ernesto Ramirez
March 8, 2014
Another collection of thought-provoking items from around the web.
Articles & Posts
Plan to move from #quantified self to Qualified Self by Inga de Waard. Every now and then someone writes something that causes me to pump the brakes and really reflect on self-tracking and personal data collection. This is one of those time. Inga does a nice job here setting up her experience with self-tracking to understand her type 1 diabetes. She moves on to explore how “qualified data” might be a better source of information for personal growth, “I am more than my body, I am mind. So I want to understand more.”
The Bracelet of Neelie Kroes (in German) by Frank Schirrmacher. Can machines be trusted? Are we building and willingly wearing the handcuffs of the future by strapping tracking devices to our wrists? These questions are explored in this article. (If you’re like me you are probably wondering who Neelie Kroes is. Here’s some background info.)
Biggest Gene Sequence project to launch by Bradley J. Fikes and Gary Robbins. J. Craig Venter is at it again. Now that genome sequencing has passed the $1000 barrier he has set up a new company in order to recruit and sequence 40,000 people per year.
This Mediated Life by Christopher Butler. Another amazing piece of self-reflection spawned by the recently released Reporter App. Rather than reviewing the application, the author addresses what it means to self-track when we know we are our own observer. Do we bias our reflection and data submission when we know that each answer, each data point is being collected into a larger set? (This post reminded me of one of my favorite movie lines, “How am I not myself.” from I Heart Huckabees
The Open Collar Project. At a recent meeting I learned of this project to create an open-source dog tracking collar. Pet trackers are becoming more prevalent in the market, but the purpose of this project goes far beyond just understanding pet activity. I learned from the lead researcher, Kevin Lhoste, that they’re using this as a method to encourage and engage children in science and mathematics. Very neat stuff.
Twitch Crowdsourcing: Crowd Contributions in Short Bursts of Time [PDF] by Rajan Vaish, Keith Wyngarden, Jingshu Chen, Brandon Cheung, and Michael S. Bernstein. This research paper describes the results of a really interesting project to gather information from people using micro-transactions during the phone unlocking process. It appears that we can learn a lot from people in under 2 seconds.
The Open FDA. Not an article here, but I wanted to call attention to the new open initiative by the FDA. This new effort was spearheaded by Presidential Innovation Fellow, Sean Herron. If you’re interested in doing this type of work you can apply to be a fellow here.
Show&Tells (a selection of first person stories on self-tracking and personal data)
200 days of stats: My QS experience by Octavian Logigan. Octavian recounts the various data he’s collected including activity, sleep, email behavior, and work productivity. I really like how he clearly explains what tools he’s using.
A Year in Diabetes Data by Doug Kanter. We’ve featured Doug here on the blog before. From his amazing visualizations to his talks about his process, we’ve been consitently impressed and inspired by this work. In this post Doug recounts 2012 – “[…] the healthiest year of my life.” (Full disclosure: Doug sent me the poster version of his data and it is beautiful.)
Visualization
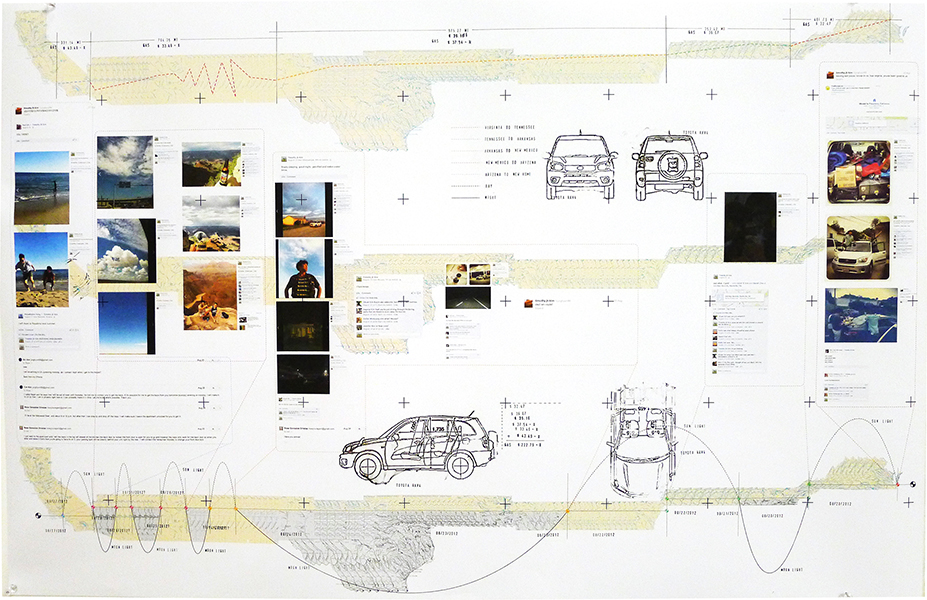
This visualization comes to us from Tim Kim, a design student based in Los Angeles.
The map shows different collections and documentations made during my cross country trip. Posts made during the trip on various social media sites are orientated and placed by the geological locations. The states are elongated by purely how I felt about the duration of going across the specific state. For example, driving through texas sucked (no offense). Different facts are layered and collaged across the map to create and express a collective, over-all image of the trip. Some quantifiable information, some quantitative information to create a psych-geolocal map.
Thumbs Up Viz A really nice website that highlights and explains the good pieces of data visualization popping up all over the web these days.
From the Forum
Tracking emotional experience
Test our a new app for sleep improvement
Measuring emotions through vital signs

