How to Represent a Year in Numbers
Ernesto Ramirez
January 20, 2015
As the calendar turns over to a new year, it’s useful to look back and see what the last 365 days have been all about. Looking back is always easier when you have something to look back on, and, no surprise here, self-tracking is a great help for trying to figure out how things went. That’s what makes this time of year so interesting for someone like myself. I spend a good deal of my time trying to track down real-world examples of people using personal data to explore their lives. Sometimes it’s easy, and sometimes it’s hard finding people willing to expose themselves and their data. However, when late December rolls around, I perk up because this is the time for those yearly reviews.
I’ve spent the last few weeks gathering up some great examples from individuals from all over the world. I hope the following examples inspire you to track something new in 2015 and maybe share it with the QS community in person at a local meetup, at our QS15 Global Conference, or in our social channels. Okay, let’s dive in!
My Year 2014 in Numbers #QuantifiedSelf by Ragnar Heil. A brief, but fun post detailing a year of music, travel, and location checkins.
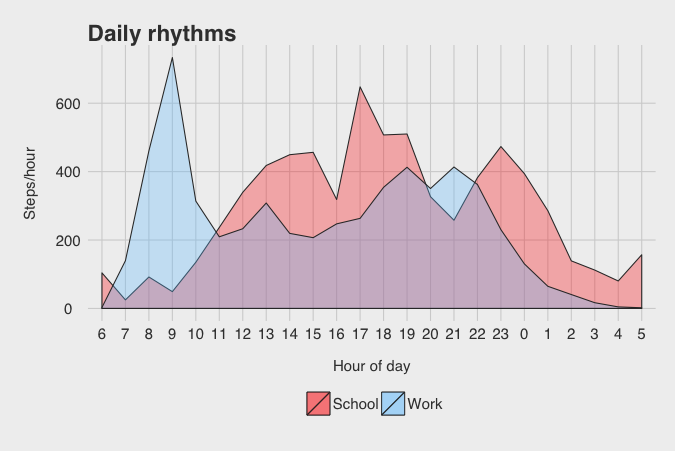
2014: A Year in Review with iPhone Pedometer Data by Geoffrey Litt. I really enjoyed this very thorough exploration of a year’s worth of pedometer data gathered from the Argus app (iOS). Not satisfied with just looking at his total step count for the year, Geoffrey ran a series of data explorations. Among my favorite, his visualization of his daily rhythms:
2014 in Numbers – My Life Behind the Command Line by Quincy Larson. Work, wellness (sleep and running) and reading – it’s all here. I like the idea of tracking what you’ve read by writing one tweet per book.
2014, Quantified by Sarah Gregory. Sarah does an amazing job of capturing and showcasing her 2014 activities in this beautifully simple post. With a balance of pure quantitative information and qualitative insights I found this review especially compelling. (It was also nice to see that she used our “How to Download Your Fitbit Data” tutorial.)
2014 in Numbers by Donald Noble. Speaking of our Fitbit data download tutorial, here’s a short post about a year’s worth of steps – 4.15 million steps to be precise.
Three Years of Running Data: 1,153km with Nike+ and Mind by Todd Green. As you can see from the title, this post details three years of running, but as a runner myself I always like peeking into other runner’s data. (Todd also has a fantastic post from early 2014 about tracking every penny he spent in 2013.)
Food, Glorious Food by Peter Chambers. A fun post detailing what Peter and his family ate for dinner nearly every day of 2014. One juicy bit – the most common meal? Chili – Peter’s favorite!
2014 in Numbers by Jill Homer. With the help of her Strava app, Jill details her cycling and running from 2014. Click for the numbers, stay for the gorgeous photos.
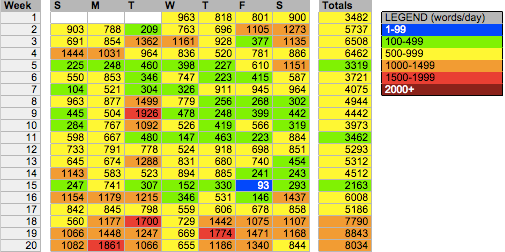
I wrote every day in 2014: Here’s an #infographic by Jamie Todd Rubin. It’s great fun following Jaime’s blog. He’s relentless on his journey of daily writing (and is quite the active Fitbit user as well). What was 2014 like for his writing? Over 500,000 words – almost enough to take on Tolstoy’s War and Peace. Plus, the visualization is great (click through for the full version):
2014 Stats by Dan Goldin. Amazing data gathered from a self-designed Google spreadsheet that includes mood, sleep, food, and drink.
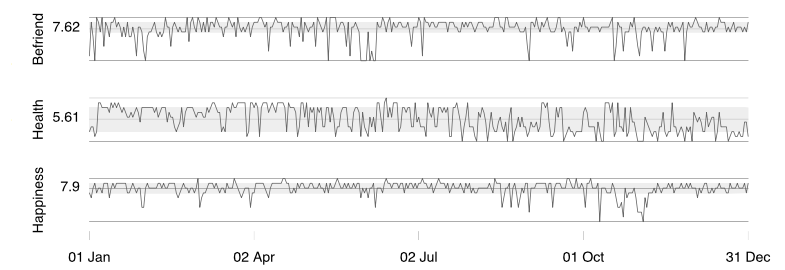
Tracking My Life in 2014 by Mike Shea. Mike tracks his life using his own custom designed “Lifetracker app.” This includes his rating on six aspects of his life, daily activities, media, and location. In this post he turns his 8,400 rows of data into elegant visualizations and interesting analysis:
A Year in Review of Personal Data, Should be, well, Personal. By Chris Dancy. As always, Chris has an interesting and entertaining post about his 2014 data and how it compares to 2013.
Tiny Preview By Lillian Karabaic. If her previous work is any indication this year’s review is going to be great. Keep in mind this is just a place holder until the full post is up.
Why #DIYPS N=1 data is significant (and #DIYPS is a year old!) by Dana Lewis. Along with her co-investigator, Scott Leibrand, Dana has been on a journey to better control, understand, and generate knowledge about her type 1 diabetes through augmenting CGM data, devices, and alerts. What started as project to make alarms more clear and useful has morphed into a full on DIY closed loop pancreas. In this post, Dana explores what they’ve learned over the last year of data collection. Truly inspiring work:
My Quantified Self Lessons Learned in 2014 by Paul LaFontaine. In this post Paul recounts what he’s learned from his various QS experiments during 2014, with a focus on stress and hear rate variability. Make sure to also take a peak at his 2014 Review and Gear Review.
2014 Year in Webcam and Screenshots by Stan James. We’ve featured Stan and his great LifeSlice project here on QuantifiedSelf.com before. It’s an ingenious little lifelogging application that tracks your computer use through webcam shots, self-assessments, and screenshots. Check out this post to see a fun representation of his data.
2014 by Kyle McDonald. A very interesting diary of a year.
What 2439 Reports Taught Me by Sam Bew. We highlighted this great post in our What We’re Reading a few weeks ago, but it deserves another mention here. Sam analyzes the data collected from using the Reporter iOS app and writes about what he learned.
2014 Personal Annual Report by Jehiah Czebotar. Coffee, travel, Citi bike trips, software development, laptop battery life, and webcam shots – all included in this amazing page. Presented without narrative or explanation, but meaningful nonetheless. The coffee consumption visualization is not to be missed (click through for the interactive version):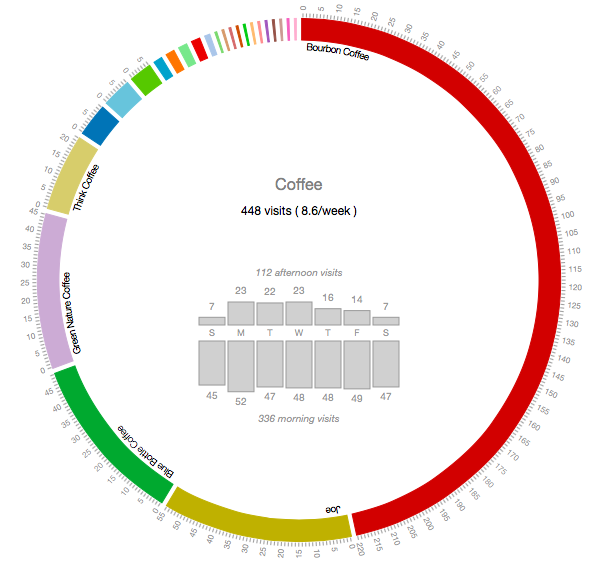
2014: My Year in Review by Sachin Monga. A mix of quantitative and qualitative data from Sachin.
My Q4 2014 Data Review by Brandon Corbin. While not a full “year in review” here, I still found this post compelling. Brandon created his own life tracking application, Nomie, and then crunched the numbers from the 60 different things he is tracking. Some great examples of learning from personal data in here.
20140101 – 20141231 (2014). Noah Kalina started taking a photo of himself on January 11, 2000. On the 15th anniversary of his “everyday” project he published his 2014 photos.
Reading
When I was spending late nights searching for variations on “2014”+”data”+”my year in review” I stumbled upon quite a few posts detailing reading stats. Here’s a good selection of what I can only assume is a big genre:
2014 Reading Stats and Data Sheets by Kelly Jensen. A great place to start if you want to track your own reading in 2015. Kelly provides links to three excellent spreadsheet examples.
My Year in Reading by Jon Page. Short and to the point, but a great exploration of format, genre, and authors.
My Year in Reading: 2014 by Annabel Smith.
My Year in Books, Unnecessarily Charted by Jane Bryony Rawson.
Well, that it for now. Special thanks to Beau Gunderson, Steven Jonas, Nicholas Felton (and many others) for sending in links and tips on where to find many of the above mentioned work. If you have a data-driven year in review please reach our via email or twitter and we’ll add it to the list!
If you’re interested in learning about how people generate meaning from their own personal data we invite you to join us for our QS15 Global Conference. It’s a great place to share your experience, learn from others, and get inspired by leading experts in the growing Quantified Self Community. Early bird tickets are on sale. We hope to see you there.
If you’ve made it this far here’s a fun treat: Warby Parker made neat little tool you can use to generate a silly personal annual report.

