Self Expression From Performance Data
Ernesto Ramirez
April 23, 2013
Typically when we think about Quantified Self and the associated collection and visualization of personal data we’re left struggling in the world of charts, graphs, and other well-worn visualizations. That’s not to disparage those of you who love spending some time tinkering in Excel. Those are valuable tools for understanding and there is a good reason we rely on them to tell us the stories of our data. It’s important to realize that those stories rooted in data aren’t always just about finding trends, searching for correlations, or teasing out significant changes. Sometimes data can represent something more visceral and organic – the expression of a unique experience.
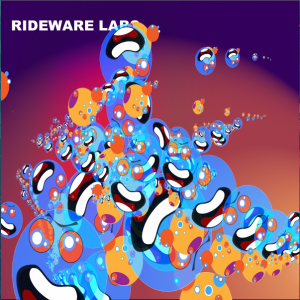
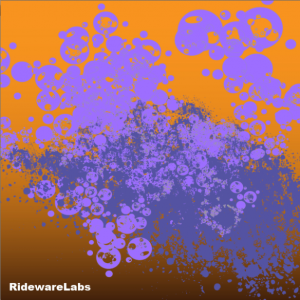
Vincent Boyce is a an artist and designer who spends his free time riding on asphalt and water. Those experiences on his longboard and surfboard led him to starting thinking about how his rides, his performances, could be used as inputs for generating art and “exposing the hidden narrative.” After some tinkering with hardware and software Rideware Labs was born. Vincent has designed and built a prototype sensor pack and custom interface that ingests data from his riding and outputs unique visual representations. As you can see above, these aren’t your typical bar charts.
In his great talk filmed at the New York QS Meetup Vincent describes his motivation behind building his prototype system and his goals for future versions.
This is a great first step in turning data rooted in performance into artistic representations of self-expression. What do you think? What kind of data would you like to see hanging on your wall as works of art? Let us know in the comments!


