Tracking Happiness: Ellis Bartholomeus
Erica Tanamachi
July 16, 2018
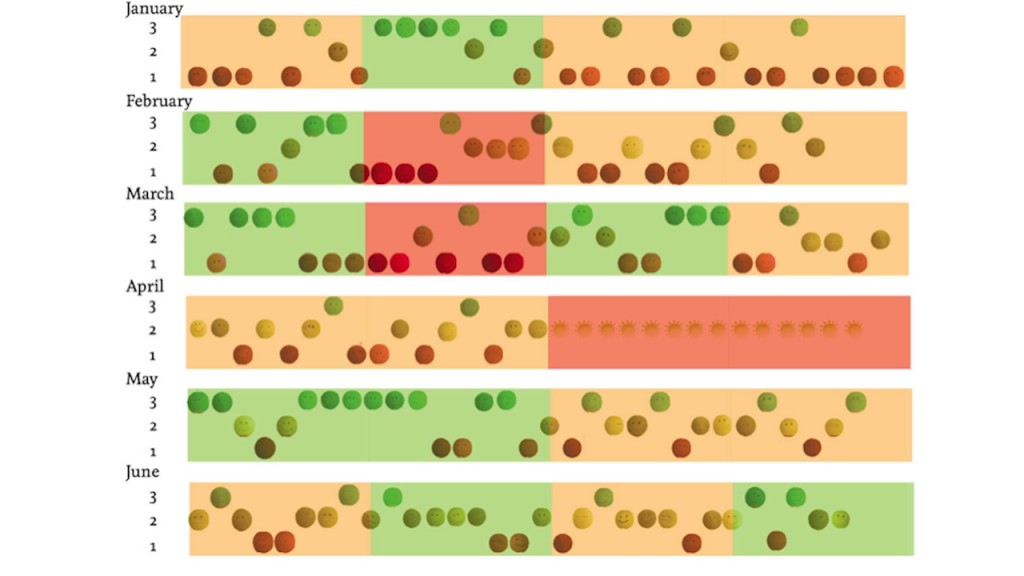
Sharing Ellis Bartholomeus, again–not only because she’s awesome–but, the project she presented at 2015 QS Europe Conference in Amsterdam, Draw a Face a Day relates to a recent post on Tracking Happiness. Like Ashish’s project, Ellis tracks her mood with 1 simple task at the end of the day–but, instead of using a number (at least not in the beginning), she draws a face: happy, sad, confused, melancholic, etc.
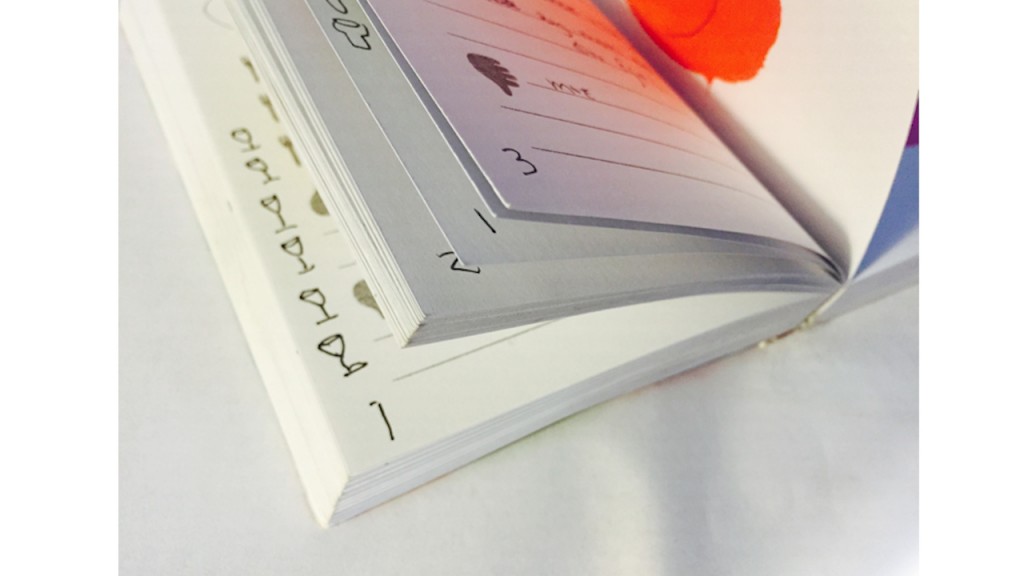
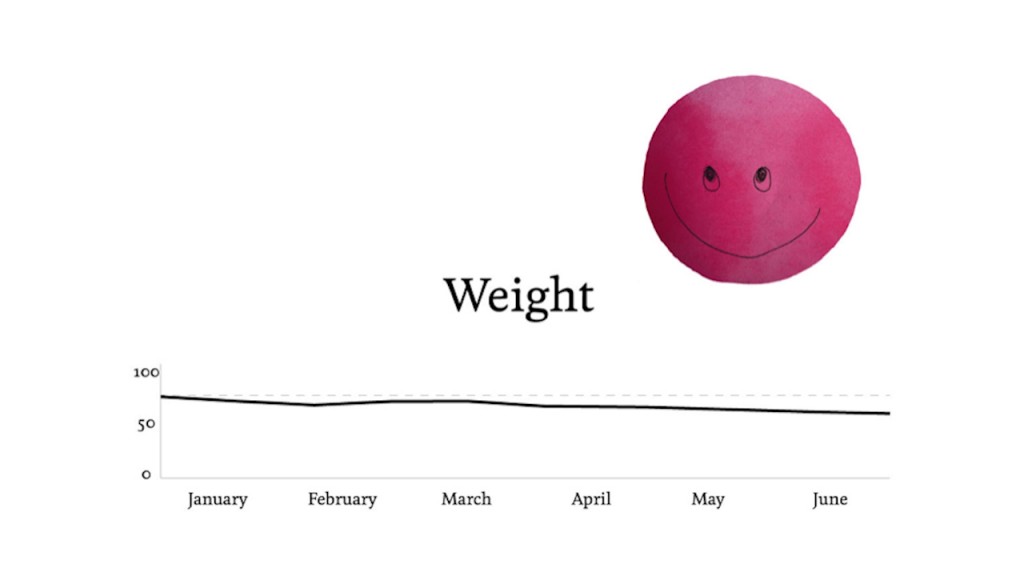
As a designer by trade, drawing is a fun way for Ellis to track her mood, however, she struggled to find ways to visualize the data to actually learn from it. She eventually came up with a number system (1-3) and a color coding system that she could then look at weeks and months at a time. She began to add to the face-a-day tracking and drew glasses of wine for each drink she had, pots for when she cooked at home, etc. She learned what color she typically lived her best life at and found that she became both happier and healthier from doing this project.


We hope you can join us to share your learnings from a project, or simply be inspired at this year’s Quantified Self 2018 Conference in Portland on September 22-23. Register here.


