Results of the Personal Informatics Survey
Ian Li
February 9, 2010
In the summer of 2009, I posted a survey of personal informatics tools on The Quantified Self, Flowing Data, and forums at personal informatics sites like Slife and MoodJam.
Many people participated describing their experiences using existing tools to track and reflect on personal information. The survey helped us develop a model to describe personal informatics systems (Figure 1).
The model is a series of five stages: Preparation, Collection, Integration, Reflection, and Action, with four properties: problems in earlier stages cascade to later stages; stages are iterative; they are user-driven and/or system-driven; and they are uni-faceted and/or multi-faceted.
From these properties, we suggest that personal informatics systems should:
1) be designed in a holistic manner across the stages;
2) support iteration between stages;
3) apply an appropriate balance of automated technology and user control within each stage to facilitate the user experience; and
4) provide support for associating multiple facets of people’s lives to enrich the value of systems.
In the rest of this post, I will talk about our findings in further detail and discuss how the model can guide the evaluation and design of personal informatics systems.
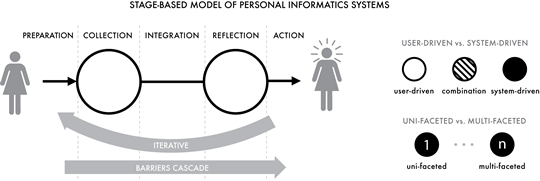
Figure 1. The stage-based model of personal informatics systems and its four properties.
(Full report after the jump.)
Information Collected
68 participants completed the survey and 11 agreed to participate in the follow-up interviews. We asked participants to select the personal information that was most relevant to them. Participants answered the rest of the survey focusing on their selection. The four types of information most relevant to participants were: finance, journaling (blogs and status updates), exercise, and general health (food consumption, weight, symptoms, medication, amount of sleep, and alcohol/caffeine intake). Other types of information were productivity, status of relationships, computer usage, transportation, habits of a newborn baby, and books read.
Table 1 is a complete list of information that people collected.
| automatic | # | manual | # |
|---|---|---|---|
| bank statements | 54 | calendar events | 27 |
| email history | 52 | status updates | 22 |
| credit card bills | 38 | work activities | 22 |
| phone call history | 26 | blog posts | 21 |
| SMS history | 25 | weight | 21 |
| IM history | 25 | exercise | 20 |
| financial software | 23 | browser bookmarks | 20 |
| electricity bill | 23 | time at work | 18 |
| browsing history | 23 | social bookmarks | 18 |
| search history | 20 | mood | 17 |
| Other automatically collected: heating bill (12), travel (2) | Other manually collected: journal/diary (16), pictures taken (14), sleeping habits (12), food consumption (12), productivity (10), health (9), medication intake (7), caloric intake (5), symptoms (5), miles ran (4), sports activities (4), blood pressure (4), blood sugar level (2), dream journal (2), step counts (2), relationship status (2), books read (1), habits of newborn baby (1), transportation (1) | ||
Table 1. Participants reported a wide variety of information that they collected and reflected on: from automatically-collected information such as bank statements and email history to manually-collected information such as status updates, work activities, and exercise. While fewer participants manually collected information, they reported a greater variety of types of information.
Reasons
Participants reported the following reasons for collecting and reflecting on personal information:
* natural curiosity: “Curiosity. How much would I walk if didn’t ride my bike?”
* general interest in data: some people described themselves as “data nerd”, “a student of information visualization”, and “geeky”
* discovery of new tools: “I’ve been following Nick Felton’s annual reports, so when he started Daytum, I joined to start tracking…”
* trigger events: some people cited problems in relationships, sleep patterns, and weight
* suggestion from another person: “a doctor’s recommendation (new medical issue, new medications”
Stages
We will now introduce each of the stages in the model of personal informatics systems. The stages are: Preparation, Collection, Integration, Reflection, and Action. For each stage, we will also describe the barriers that people experienced.
The Preparation stage occurs before people start collecting personal information. It concerns people’s motivation for tracking, identification of what information to track, and selection of what tools to use for tracking. Problems can occur when users choose the wrong information to track or when users select an inappropriate tool that does not satisfy the user’s information needs. These incorrect selections can lead to data loss and wasted time.
The Collection stage is the time when people collect information about themselves, such as their inner thoughts, behavior, social interactions, and their immediate environment. Many problems occur because of collection tools. Some problems occur because of the user’s lack of time, lack of motivation, or forgetfulness. Other problems are data-related: some data are hard to estimate, subjective data lack standard ratings, and some data are difficult to find.
| Collection Barriers | Example Quote |
|---|---|
| Tool (13/68) | “not having ready access to a computer at the time symptoms happen” P6 |
| Remembering (12/68) | “Forgetting to record it. Because I am often not at my personal computer.” P57 |
| Lack of time (11/68) | “not difficult, time consuming at times.” P16 |
| Finding data (7/68) | “Sometimes life isn’t interesting enough to make me want to write it down, other times I can’t find any worthy writing material.” P54 |
| Accuracy (6/68) | “Guestimating mass of food matching homemade or restaurant foods against database entries” P5 |
| Motivation (5/68) | “keeping up the motivation to do so, finding payback for the investment of time and effort.” P4 |
Table 2. Collection barriers.
Integration is the stage where the information collected are prepared, combined, and transformed for the user to reflect on. Problems occurred when collected data comes from multiple inputs, when visualizations are scattered, and when the data collection format is different from what the visualization requires.
| Integration Barriers | Example Quote |
|---|---|
| Transcribing data (10/68) | “It’d be neat if I could graph it straight from the website instead of manually typing in the data to a spreadsheet” P41 |
| Organization (8/68) | “Collecting is simple. Organizing it takes some time.” P29 |
| Scattered visualizations (4/68) | “A bit cumbersome going to so many different sites [for visualizations]” P6 |
| Multiple inputs (3/68) | “Difficult to keep organized because sometimes data are kept in separate places” P31 |
Table 3. Integration barriers.
The Reflection stage is when the user reflects on their personal information. Users may reflect on the information immediately after recording (short-term) to be aware of their current status. Users may reflect after several days or weeks (long-term) to see trends and patterns. There may be problems during this stage because of lack of time, self-criticism, and problems with retrieving, exploring, and understanding information.
| Reflection Barriers | Example Quote |
|---|---|
| Lack of time (10/68) | “Having time to go through everything, but that is also one of my biggest pleasures is finding that time.” P19 |
| Visualization (6/68) | “It’s hard to get a holistic view of the data since the time filters are at most one month and I’d like to look at several months at once.” P48 |
| Self-criticism (5/68) | “It’s extremely difficult (psychologically) to look back on my earliest journals. Much of that information is very emotional and innocent.” P12 |
| Interpretation (5/68) | “Sometimes its very difficult to interpret the media” P54 |
| Search (4/68) | “not too tough. sometimes have to wait while search occurs… but it’s a couple minutes at most” P14 |
| No context (3/68) | “Not having an overlay of changes in circumstance” P11 |
| Sparse data (3/68) | “Not enough; My collection of data has been intermittent enough that I don’t get good time series.” P44 |
| Data is not useful (3/68) | “it’s really not very useful and it’s kind of annoying. I mean, I walk a lot. What else do I really want to know?” P22 |
Table 4. Reflection barriers.
The Action stage is the stage when people choose what they are going to do with their newfound understanding of themselves. Some may tailor their behaviors to match their goals. Some systems alert users when particular thresholds are met. Some systems provide incentives to motivate users to take action.
Properties of the Stages
As a whole, the stages have four properties that have implications for the design and development of personal informatics systems.
The first property is that problems in earlier stages affect the later stages. For example, not selecting the right tool during the Preparation stage may lead to reflecting on incorrect data. Another example is that problems in the Collection stage may lead to sparse data, which may be insufficient for insightful reflection. This property suggests that the development of personal informatics systems should be approached holistically. Of course, we should take inspiration from different fields to resolve problems within each stage (e.g., visualization techniques from the information visualization community), but development should not focus only on one stage, but consider the whole experience of the user throughout the different stages.
The second property is that the stages are iterative; users will incorporate new data, tools, and processes as they progress through the stages. For example, a user may change the types of physical activity she performs. These changes require selecting a new tool, collecting new types of data, and reflecting on different visualizations. Often times, the user cannot bring their old data along with them. This causes problems because it makes comparing between different types of physical activity more difficult. This property suggests that systems should be flexible to support users’ changing information needs. Some examples are support for easy importing and exporting of data and rapid iteration so that users can hone in on the questions they want to answer.
The third property is that each stage can be classified as user-driven, system-driven, or a combination of both. In a user-driven stage, the user is responsible for the activity in the stage, while in a system-driven stage, the system is. For example, a user-driven Collection stage may require users to record information into a spreadsheet, while a system-driven stage may use sensors to track personal information. This property suggests that there are opportunities to alleviate the demands on the user using automation; however, developers should consider the tradeoffs (e.g., inaccuracy of automated tracking and loss of user control.)
The fourth property concerns facets of a person’s life. Most systems are uni-faceted, collecting only one facet of a person’s life (e.g., Mint for financial matters, Nike+ for physical activity). Some systems are multi-faceted, collecting multiple facets of a person’s life (e.g., Daytum, your.flowingdata). However, such systems usually present multiple facets in separate visualizations. Many participants expressed their desire to see associations between different facets of their lives. This property opens several opportunities to explore how applications can better support awareness of associations between different facets of life.
Summary
We believe that the stage-based model, the identification of the barriers within each stage, and the description of the properties of the stages will be valuable for future research and development because it provides a common framework for describing, comparing, and evaluating personal informatics systems. We hope that this model would help developers and designers improve their systems, encourage creation of new applications, and guide exploration of new approaches and solutions.
Reference
Ian Li, Anind Dey, and Jodi Forlizzi. A Stage-Based Model of Personal Informatics Systems. CHI 2010. (Download the full paper)

