The Visualization Zoo
Alexandra Carmichael
May 25, 2010
A Stanford professor in Human-Computer Interaction and Quantified Self advisor on data visualization, Heer and his colleagues Mike Bostock and Vadim Ogievetsky have put together a terrific guide to the various kinds of data visualization, and when and how to use each one.
They call their guide A Tour through the Visualization Zoo:
“In 2010 alone we will generate 1,200
exabytes–60 million times the content of the Library of Congress. Within
this deluge of data lies a wealth of valuable information on how we
conduct our businesses, governments, and personal lives. To put the
information to good use, we must find ways to explore, relate, and
communicate the data meaningfully…Well-designed visual representations can replace cognitive calculations
with simple perceptual inferences and improve comprehension, memory, and
decision making. By making data more accessible and appealing, visual
representations may also help engage more diverse audiences in
exploration and analysis…Creating a visualization requires a number of nuanced judgments. One
must determine which questions to ask, identify the appropriate data,
and select effective visual encodings to map data values to
graphical features such as position, size, shape, and color.”
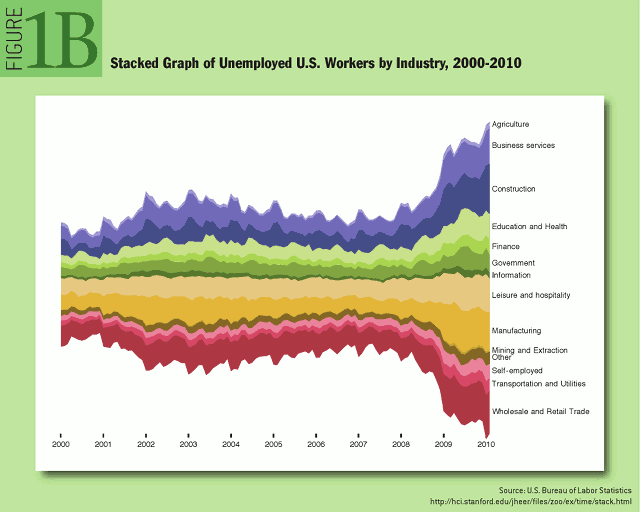
Stops along the tour include Time-Series Data, Statistical Distributions, Maps, Hierarchies, and Networks. Each one is broken down into subtypes, with helpful examples that can be applied to your own dataset.
The authors end with a challenge:
“As you leave the zoo and head back into the wild, try deconstructing the
various visualizations crossing your path. Perhaps you can design a
more effective display?”

