Bay Area QS Show&Tell #16 – Recap
Alexandra Carmichael
October 9, 2010
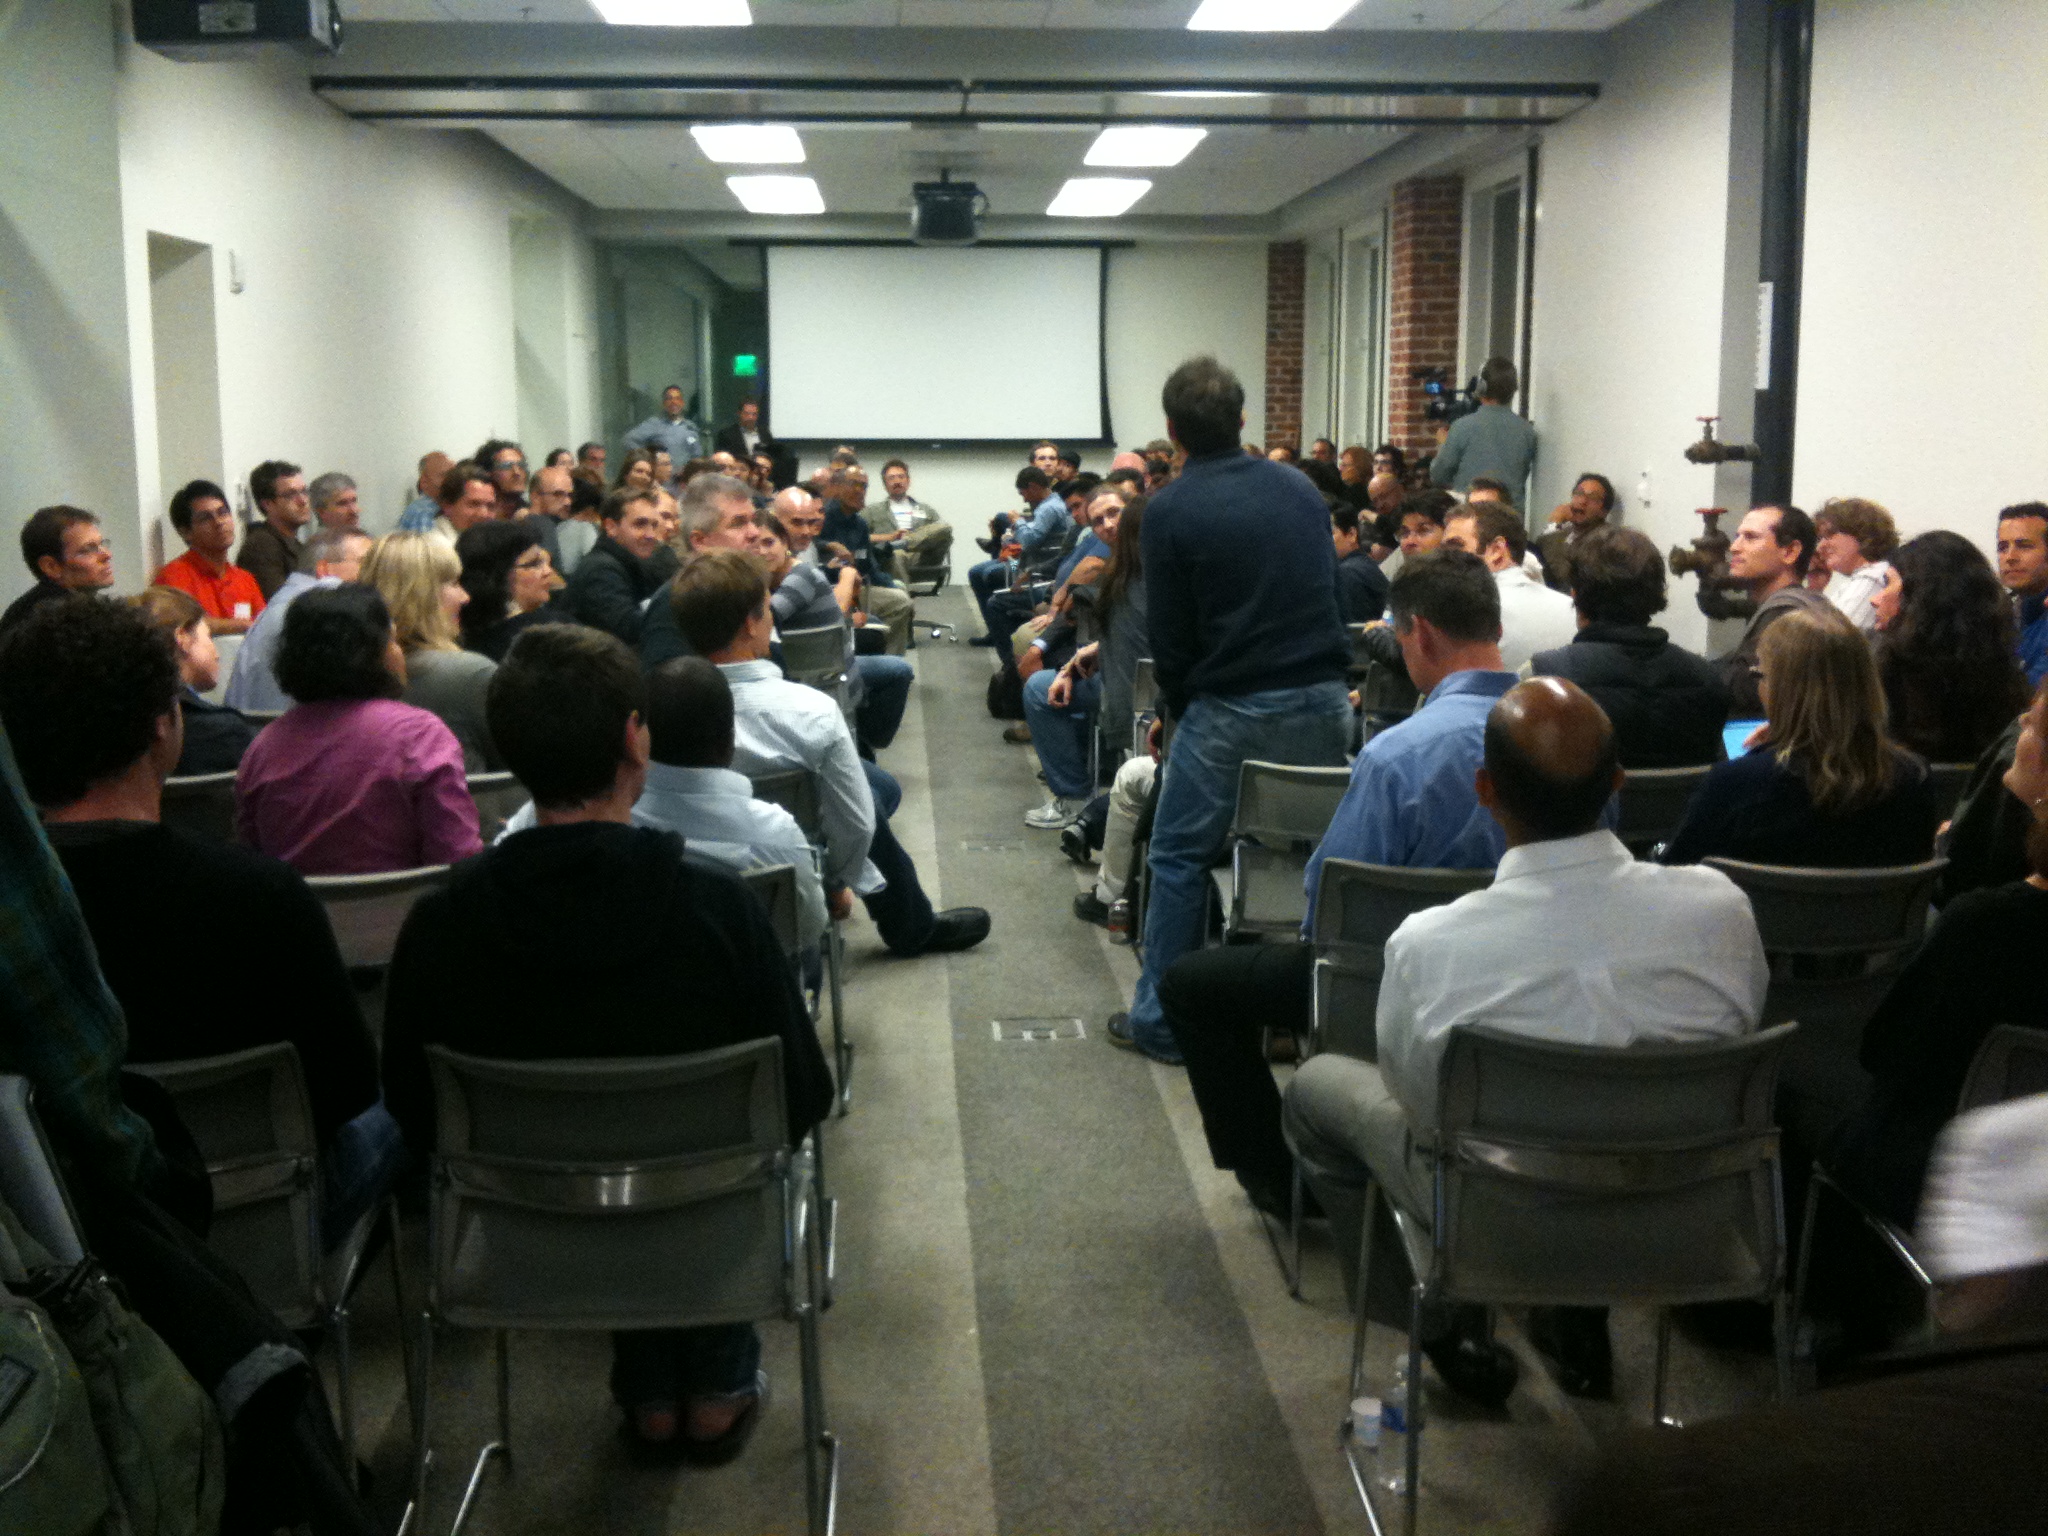 It was another electric night. On Wednesday, 124 people gathered at the futuristic Autodesk Gallery in San Francisco for the 16th Bay Area QS Show&Tell. The theme this time was location, transportation, consumption, and energy.

What has Matt learned from running Fuelly? After 10 fillups, you know what your average is, so it is a challenge to get people to keep coming back to enter data that doesn’t change much. Also, he chose not to have leaderboards of any kind, since they are just an invitation for gaming the system.
Up next was Max Winter Osterhaus, whose tagline was “I make charts.” Max has been tracking all of his purchases and consumption for the past 5 years in incredible detail – right down to the kind of fruit or bread. He said combing through receipts has become somewhat of an addiction. After a while he felt like the data didn’t mean anything and wasn’t integrated into his life, so he started making visual charts for his body, garden, and other systems in his life. One of Max’s charts is below.
Why does Max do this? He wants to understand the complexity of his life, supplement his memory, and see how everything fits together. A surprising thing he learned was that he spends $2,200 per year on food, and $1,000 on his cell phone.

Eri Gentry introduced the Butter Mind/Coconut Mind experiment, which she will post about soon on this blog.
Sastry Nanduri from HealthTap talked about the recent “hacking 4 health” day and the growing HealthTap Developer Network. Gary suggested having a “hacking personal data” day to continue the trend.
Andrew Hessel from Singularity University gave an engaging talk on his 2010 flight log. He has traveled 79,922 miles this year – 57 flights, 22 airports, 16 percent of his days with some part of the time in the air.
Unlike the other speakers, Andrew does not track with an implicit or explicit goal to minimize consumption. We didn’t have time for questions, but an audience member later expressed concern about the environmental impact of so much air travel.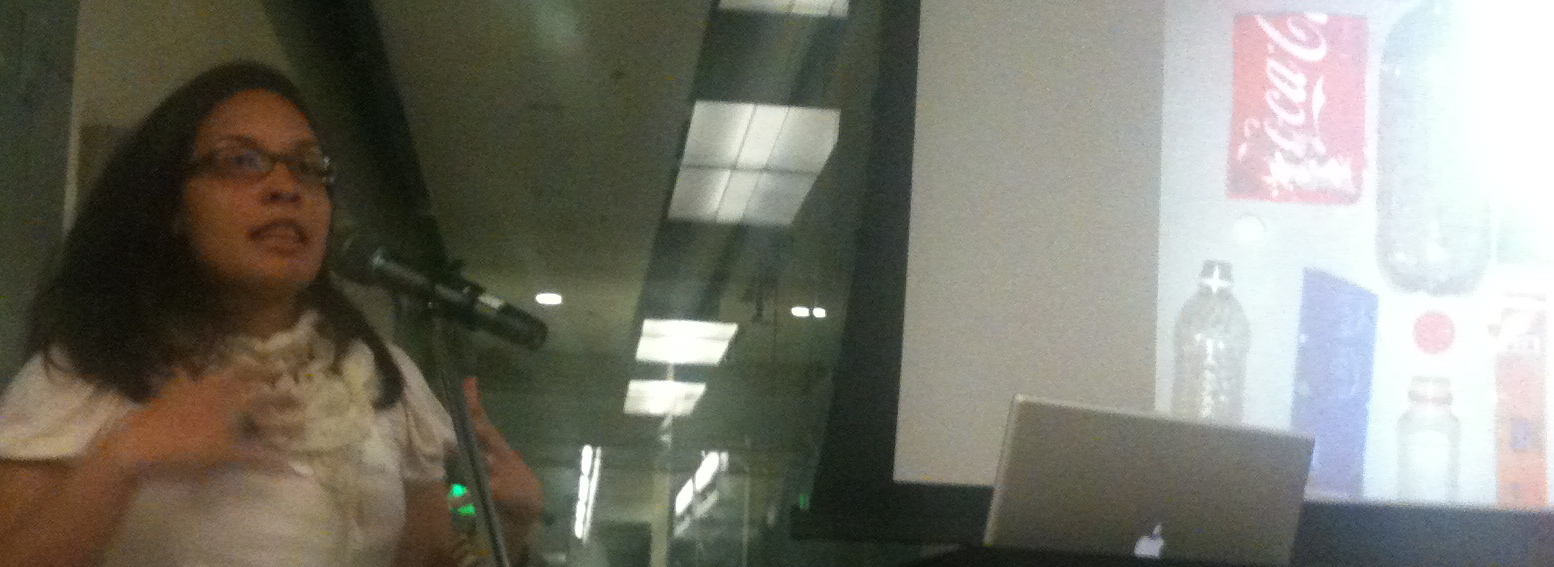
Dirk Aguilar closed out the night by showing us charts of his energy consumption – electricity, gas, driving, and flying. He annotated his graphs with trips and life changes like working
from home and learning how to make pizza, which helped him understand how his energy use was affected by variables other than the outside temperature.