QSEU14 Breakout Session: Telling Stories With Data
Ernesto Ramirez
May 22, 2014
Today’s post comes to us from Kitty Ireland, who co-led the Telling Stories With Data breakout session at the 2014 Quantified Self Europe Conference. You’re invited to read her description of the session and then join the discussion on the QS Forum. You can also view and download their session presentation here.
Telling Stories With Data
by Kitty Ireland
One theme at this year’s QS Europe conference was how we connect the practices and calculations of the Quantified Self to the emotional side of the human experience. Adrienne Andrew Slaughter and I hosted a breakout discussion on telling stories with data. The conversation evolved from how we tease out stories from personal data to why we do so. What makes a story interesting? Many of the stories we can tell with data don’t really tell us much of anything new. Sometimes it takes some exploration to draw out something revelatory. And in fact sometimes there may not be anything revelatory at all, but there’s always a story.
In the case of QS, the story is often character-driven, meaning the narrative follows some kind of personal transformation. On the other hand, when you start to look at data in aggregate (either multiple data types from an individual, or data from multiple individuals) a plot-driven narrative is more likely to emerge. You begin to see correlations, themes, and distinct plot points.
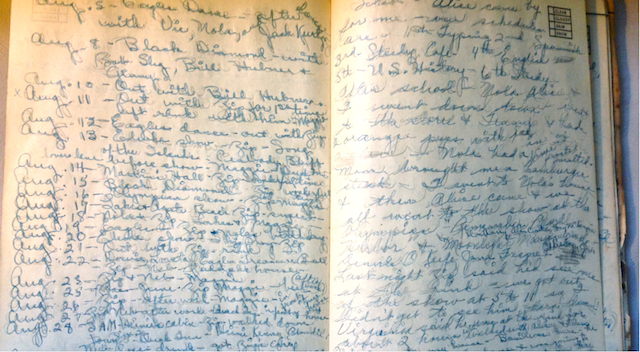
Last year, I went through an exercise with my grandmother’s diary from 1942 to see if the story in the “data” of the diary reflected her emotional truth. Diaries are by nature messy collections of data. They are inconsistent and incomplete, and in the case of my grandmother’s, nearly illegible. In order to pull out a data set, I had to look at what she tracked most consistently. This turned out to be her relationships with boys.
Counting mentions of boys’ names allowed me to create a data visualization of my grandmother’s relationships over the course of 1942. This gave me a better understanding of her emotional connections. Each boy followed a similar pattern — a steep peak followed by a slow fade — until she fell in love with Zip in August. He blew the other boys out of the water, and his numbers kept rising even after he went off to war.
Adrienne extracted her location data from Saga and created a visualization of her past 12 months. She explained how Saga adds contextual layers on top of the raw location traces, including named places, categories of places, whether this place is home or a workplace, and how much time you’ve spent there. With this extra data it is easy to see Adrienne’s typical routine, and breaks from routine appear as visual anomalies. Seasonal changes show up as subtle shifts — such as earlier commute times during the school year — which become more obvious when she extracts her daily departure time.
One question that came up is whether this kind of day-to-day routine data makes an interesting story, or are only the anomalies worth exploring? It really depends on what question you’re trying to answer, and sometimes you have to look at the data from a few angles to dig up the right question.
In looking at my grandmother’s diary, the daily details of her life give context to the wartime story of love and loss that emerges. To understand Adrienne’s story, it helps to visualize her routine to understand what plot points cause breaks in routine. In order to build a more complete story, we look for patterns and also deviations from those patterns.
Ultimately, telling stories is how we connect to each other, learn from each other, and transmit our culture. As the tsunami of personal data continues to expand, we need the right tools to understand what stories the data tells. Our data can be a rich repository of stories for ourselves, our descendants, and the archives of human history, if we can extract and preserve meaning.
If you’re interested in joining the discussion about how we can tell better stories about our lives with and through data make sure to join the discussion on the forum!

