Randy Sargent: Unlocking Patterns with Spectrograms

Steven Jonas
September 12, 2016
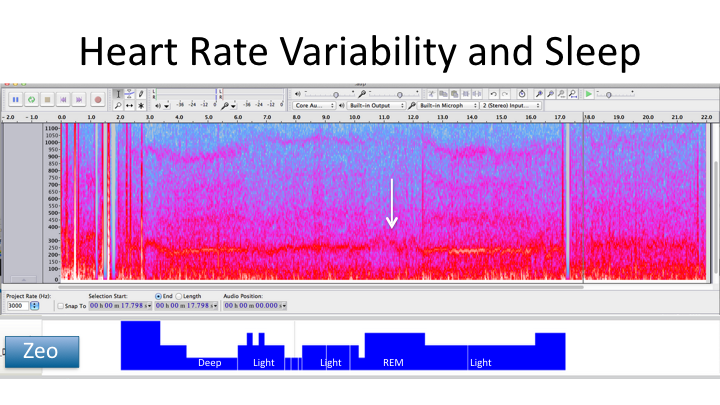
In this talk, Randy Sargent shows how he used a spectrogram, a tool mostly used for audio, to better understand his own biometric data. A spectrogram was preferable to a line graph for its ability to visualize a large number of data points. As Randy points out, an eeg sensor can produce 100 million data points per day. It is unusual for a person to wear an eeg sensor for that long, but Randy used the spectrogram on his heart rate variability data that was captured during a night of sleep. In the video, you’ll see an interesting pattern that he discovered that occurs during his REM sleep.


