What We Are Reading
Ernesto Ramirez
September 13, 2014
Before we get to this week’s list we want to make sure you know about our recent conference announcement. This week we announced our QS15 Conference & Exposition. This will be our seventh conference and is sure to be an amazing event. We invite you to register today!
Now on with the good stuff!
Articles
Why Big Data Won’t Cure Us by Gina Neff. A great research paper in the aptly name journal, Big Data. Dr. Neff specifically focuses on the perils of assuming “all the data” will solve the numerous health healthcare problems and then lays out five elements to consider as data, big and small, becomes part of our healthcare experience.
More Than Meets the Eye: NASA Scientists Listen to Data by Kasha Patel. Apparently the scientists studying the sun have so much data to sift through that listening to signals is a valuable alternative to visualizing it. (via our friend Joost Plattel)
Quantified Dating, Relationships, and Sex by Kitty Ireland. A great series of three posts by Kitty that explores a variety of examples of using self-tracking in the most intimate of situations – dating, long-term relationships, and sex.
A Look Back At the Evolution of Wearable Tech. In the wake of the recent Apple Watch announcement I love being able to look back at the history of different how technology has made inroads into our lives.
Show&Tell
The Baby Measureur by Erich Morisse. Erich is a proud father of a new child and like any new dad with data skills he started tracking some important metrics such as feeding time, feeding duration, and of course diaper changing!
A Day at Burning Man, Visualized Through Health Tracker Data by Gregory Ferenstein. Gregory takes his Basis Band to Burning Man and shows us what he learned.
Visualizations
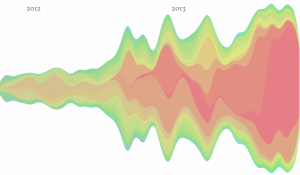
My Most Intimate Self Portrait by Scott Ogle. Scott has a wonderful post here about a visualization of his almost 30,000 text messages.
If I look closely, I can see a new job, vacations and a death in the data. I can even see where I moved past it all and stopped feeling the need to communicate so much. It may just be text messages, but it all correlates to things that are really real.
And all of it is captured in this graph.
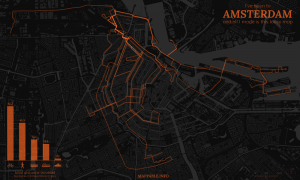
9 Days in Amsterdam – Tracking my Mobility in Bicycle Wonderland by Patrick Stotz. Patrick traveled to Amsterdam and tracked his stay using OpenPaths. I especially enjoyed how he was able to segment his means of transportation. If you’re interested in maps I suggest take a look at his great checklist for making geodata visualizations and this list of geodata tools.
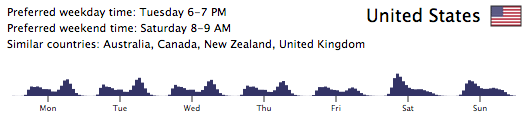
What Time of Day Do People Run by Data @ Runkeeper. As a runner I can’t get enough of these visualizations and data analyses.
From the Forum
How to Replicate SleepCycle?
What Application Can Monitor My Levels of Energy?
HealthKit
Quantified Baby

