What We Are Reading
Ernesto Ramirez
November 1, 2014
We’re back after missing last week (sorry!) with a bit longer list than usual. Enjoy!
Articles
Thoughts on Quantified Self for Modifying Long Term Life Goals by Mark Krynsky. Mark, a member of our QS Los Angeles meetup group, is consistently putting together interesting ideas in the QS space. In this short post he explore how QS tools might be used to understand long-term life goals.
Open Data for Open Lands by Alyssa Ravasio. The value of data isn’t confined to what we can understand about ourselves. There is so much beneficial information out there, especially when it comes to public data. In this post, Alyssa makes the case for protecting and promoting open data ideas and concepts regarding out most precious public spaces – the national parks system.
Art at the Edge of Tomorrow: Lillian Schwartz at Bell Labs by Jer Thorpe. A wonderful biographical piece about Lillian Schwartz, a pioneer in the field of computational art and exploration.
Terms of Service by Michael Kelller and Josh Neufeld. A reporter and nonfiction cartoonist team up to use a comic to tell us about the new world of data and privacy we currently inhabit. Interesting format and compelling content!
Show&Tell
Narrative Camera by Morris Villarroel. Morris has been wearing a Narrative personal camera for six months. In this short post he explains what he’s learned and experienced over that time.
Where my 90 Hours of Mobile Screen Time in September Went by Bob Stanke. Bob used an app (Trackify) on his Android phone to track how much time he was spending on his phone and what apps he used the most.
Quitting Caffeine by Andrei-Adnan Ismail. Andrei wasn’t happy with his relationship with coffee and caffeine so he he decide to try and quit. Using tracking and really interesting use of “sprints” to gradually reduce his consumption, Andrei was able to quit. Great post here describing his process and the data he gathered along the way (including how his change affected his sleep).
Twitter Pop-up Analytics by Myles Harrison. Myles takes us through the process of downloading, visualizing, and analyzing personal data from Twitter.
Visualizations
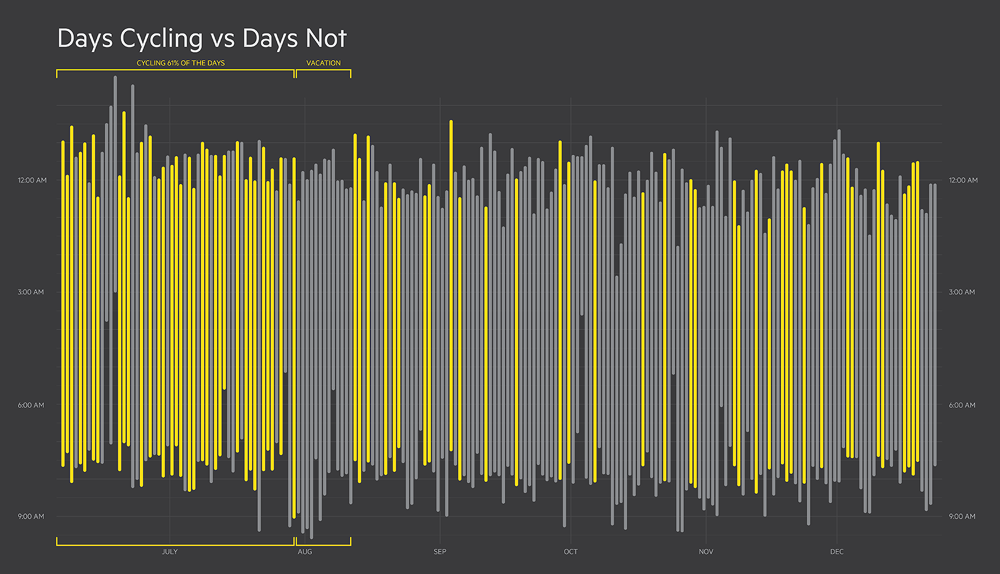
Seven Months of Sleep by Eric Boam. A bit of an old one here, but beautiful and informative nonetheless. Make sure to read the accompanying piece by Eric. (I’m also looking forward to seeing more about this dataviz of his Reporter app data soon.)
 My latest effort to visualize my calorie intake and weight loss by reddit user bozackDK. Using data collected from MyFitness pal, bozackDK has created this great visualization of his data. I asked what was learned from making this graph and received this wonderful response:
“I make graphs like these to keep myself going. I need some kind of proof that I’m doing alright, in order to keep myself wanting to go on – and a graph showing that I can (somewhat) stay within my set limits, and at the same time showing that it actually works on my weight, is just perfect.”
From the Forum
Using Facial Images to Track Mood?
Can You Track Inner Peace?
Different Approach to ZEO Headband
How Far Are You Quantified?
Google Fit

