What We Are Reading
Ernesto Ramirez
November 29, 2014
Articles
LifeLogging: Personal Big Data by Cathal Gurrin, Alan Smeaton, and Aiden Doherty. A wonderful overview of the field of lifelogging. Special attention is given to how information retrieval plays a role in how we can understand and use our lifelogs.
What happens when patients know more than their doctors? Experiences of health interactions after diabetes patient education: a qualitative patient-led study by Rosamund Snow, Charlottle Humphrey, and Jane Sandall. In this qualitative study, the authors engaged with 21 patients with type 1 diabetes who had developed expertise about their condition. Some interesting findings about how healthcare providers may be uncomfortable with patient who understand themselves and their condition. (Thanks to Sara Riggare for sharing this article with us!)
Internet of You: Users Become Part of the City-as-a-System by Tracy Huddleson. An good look into how wearables and personal technology might have an impact on the public infrastructure, institutions, and spaces.
Welcome to Dataland by Ian Bogost. Not sure how I missed this one piece from late July, but glad I stumbled across it this week. Ian Bogost takes a tour through the actual and imagine implications of the Disney Magic Band. I especially enjoyed the historical context describing the history of futurism at Disney.
Show&Tell
Gary Wolf on Cool Tools Show #15. QS co-founder, Gary Wolf, speaks with Mark Frauenfelder and Kevin Kelly on the Cool Tools Podcast about his favorite self-tracking tools and what he’s learned from using them.
My Life Analysis Spreadsheet by Reddit user batting_1000. A really interesting example of using Excel to track various aspects of daily life. Make sure to click through for the example screen shots.
Visualizations
 My heart rate during Interstellar (via Basis Peak) by Reddit user javaski. An nice use of the BasisRetreiver tool to download and analyze heart rate data from the new Basis Peak device.
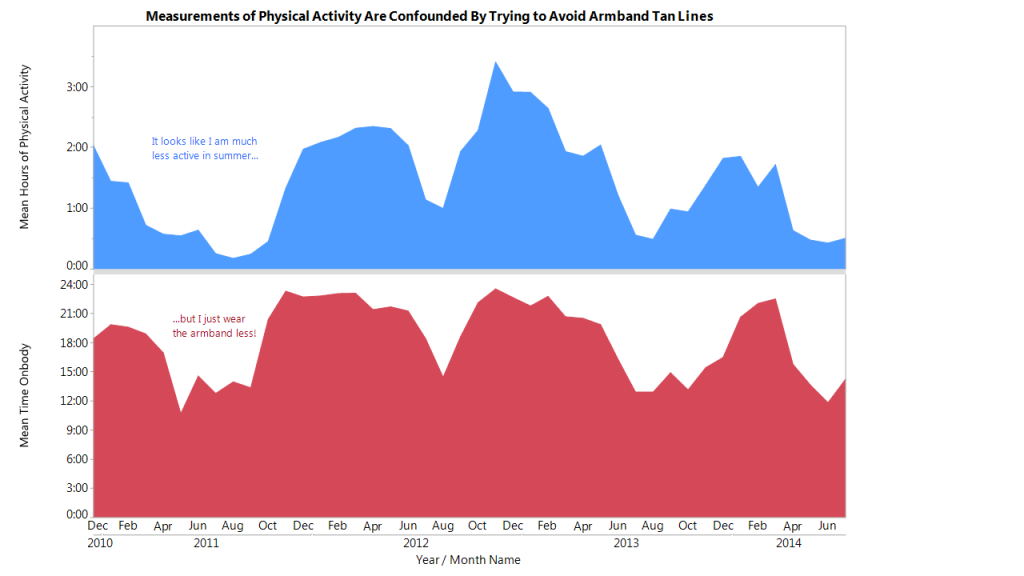 Activity Time vs. Device Wear Time by Shannon Conners. Shannon plotted her actual wear time using the BodyMedia Fit against the activity data to show that low activity numbers are probably caused by hotter summer months when wearing the armband caused unwanted tan lines.
“If I had not explored my activity and usage data first to remind me of this usage pattern, I could have created any number of plausible explanations for why my activity levels were so much lower during the hot North Carolina summer months.”
From the Forum
Wearable for Stress – Olive
Necklace worn fitness trackers?
MoodTraces App
New Heart Rate Variability and Coherence Papers
Artistic Apps
This Week on QuantifiedSelf.com
Ben Finn: Improving My Sleep
Nan Shellabarger: 26 Years of Weight Tracking

