What We Are Reading
Steven Jonas
October 26, 2015

A plate from “Food-Data” by artist Tobias Zimmer
Featured
Tobias Zimmer tracked what he ate and, in particular, what he didn’t eat. The image above comes from a series of ceramic plates that were created using generated graphics based on the crumbs he left. For more, see his Tumblr: Food-Data:
»Food Data« elevates an everyday occurrence to the realms of art. Minimalistic crumb compositions that emerge while eating every day, are enhanced by generated graphics, which refer to the topic of computerized data tracking of human behavior. The final plates encourage to contemplate on everyday life and to find beauty in daily routines, but at the same time remind of technological advancement and practices of (self-)surveillance, that doesn‘t even stop before the private ritual of eating.
Articles
Haunted By Data by Maciej Cegłowski. A keen sense of how things can go wrong is needed if we are to have any hope of – well, if we are to have any hope! This essay by Maciej Ceglowski about the highly toxic nature of large scale data aggregation is highly recommended.
How Your Device Knows Your Life through Images by Graham Templeton. This research demonstrating that an artificial neural network was able to train itself to correctly identify 83% of the time the activity that a person was engaged, just based on the images collected from that person’s lifelogging camera is especially interesting in light of Ceglowski’s talk.
Show&Tell
Life Stress by Marco Altini. Marco reviews an exhilarating but stressful 15 months of his life through the lens of heart rate variability.
Body Metrics Under Stress by Justin Lawler. Another stress-related piece. Justin shows through data how his body responded to the stress of giving a talk about his lifelogging experiences at QSEU15.
Visualizations
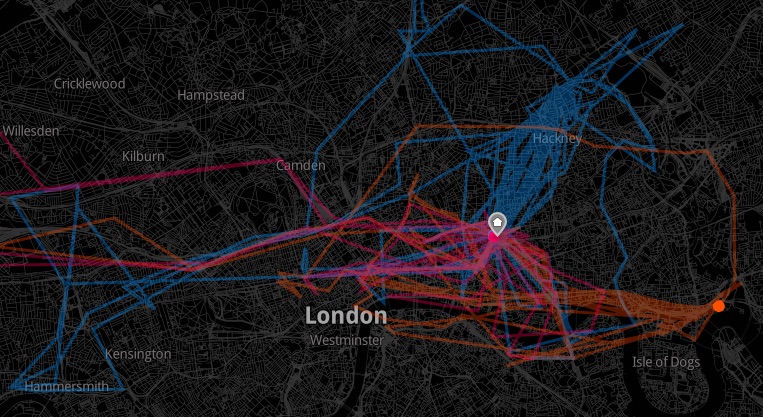
Pathways Project by Mimi Onuoha. This project looked at what story could be told from a month’s worth of mobile phone data from four groups of people, each with a different type of relationship: co-workers, a couple, a family, and roommates. The charts are interactive and fascinating. As Onuoha writes:
…data visualizations add a level of abstraction over real world events; they gather the messiness of human life and render it in objective simplicity. In life, goodbyes can be heartbreaking affairs, painful for all involved. But on a map, a goodbye is as simple as one dot moving out of view.
The project’s data is available in this Github repository.
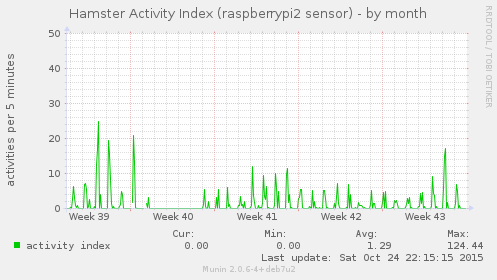
My Hamster’s Activity Index by /u/snootsboots
This reddit user used a motion sensor connected to a raspberry pi to make sure that his hamster is ok when he’s away. Here’s a picture of the hamster, if you’re curious. His name is Timmy
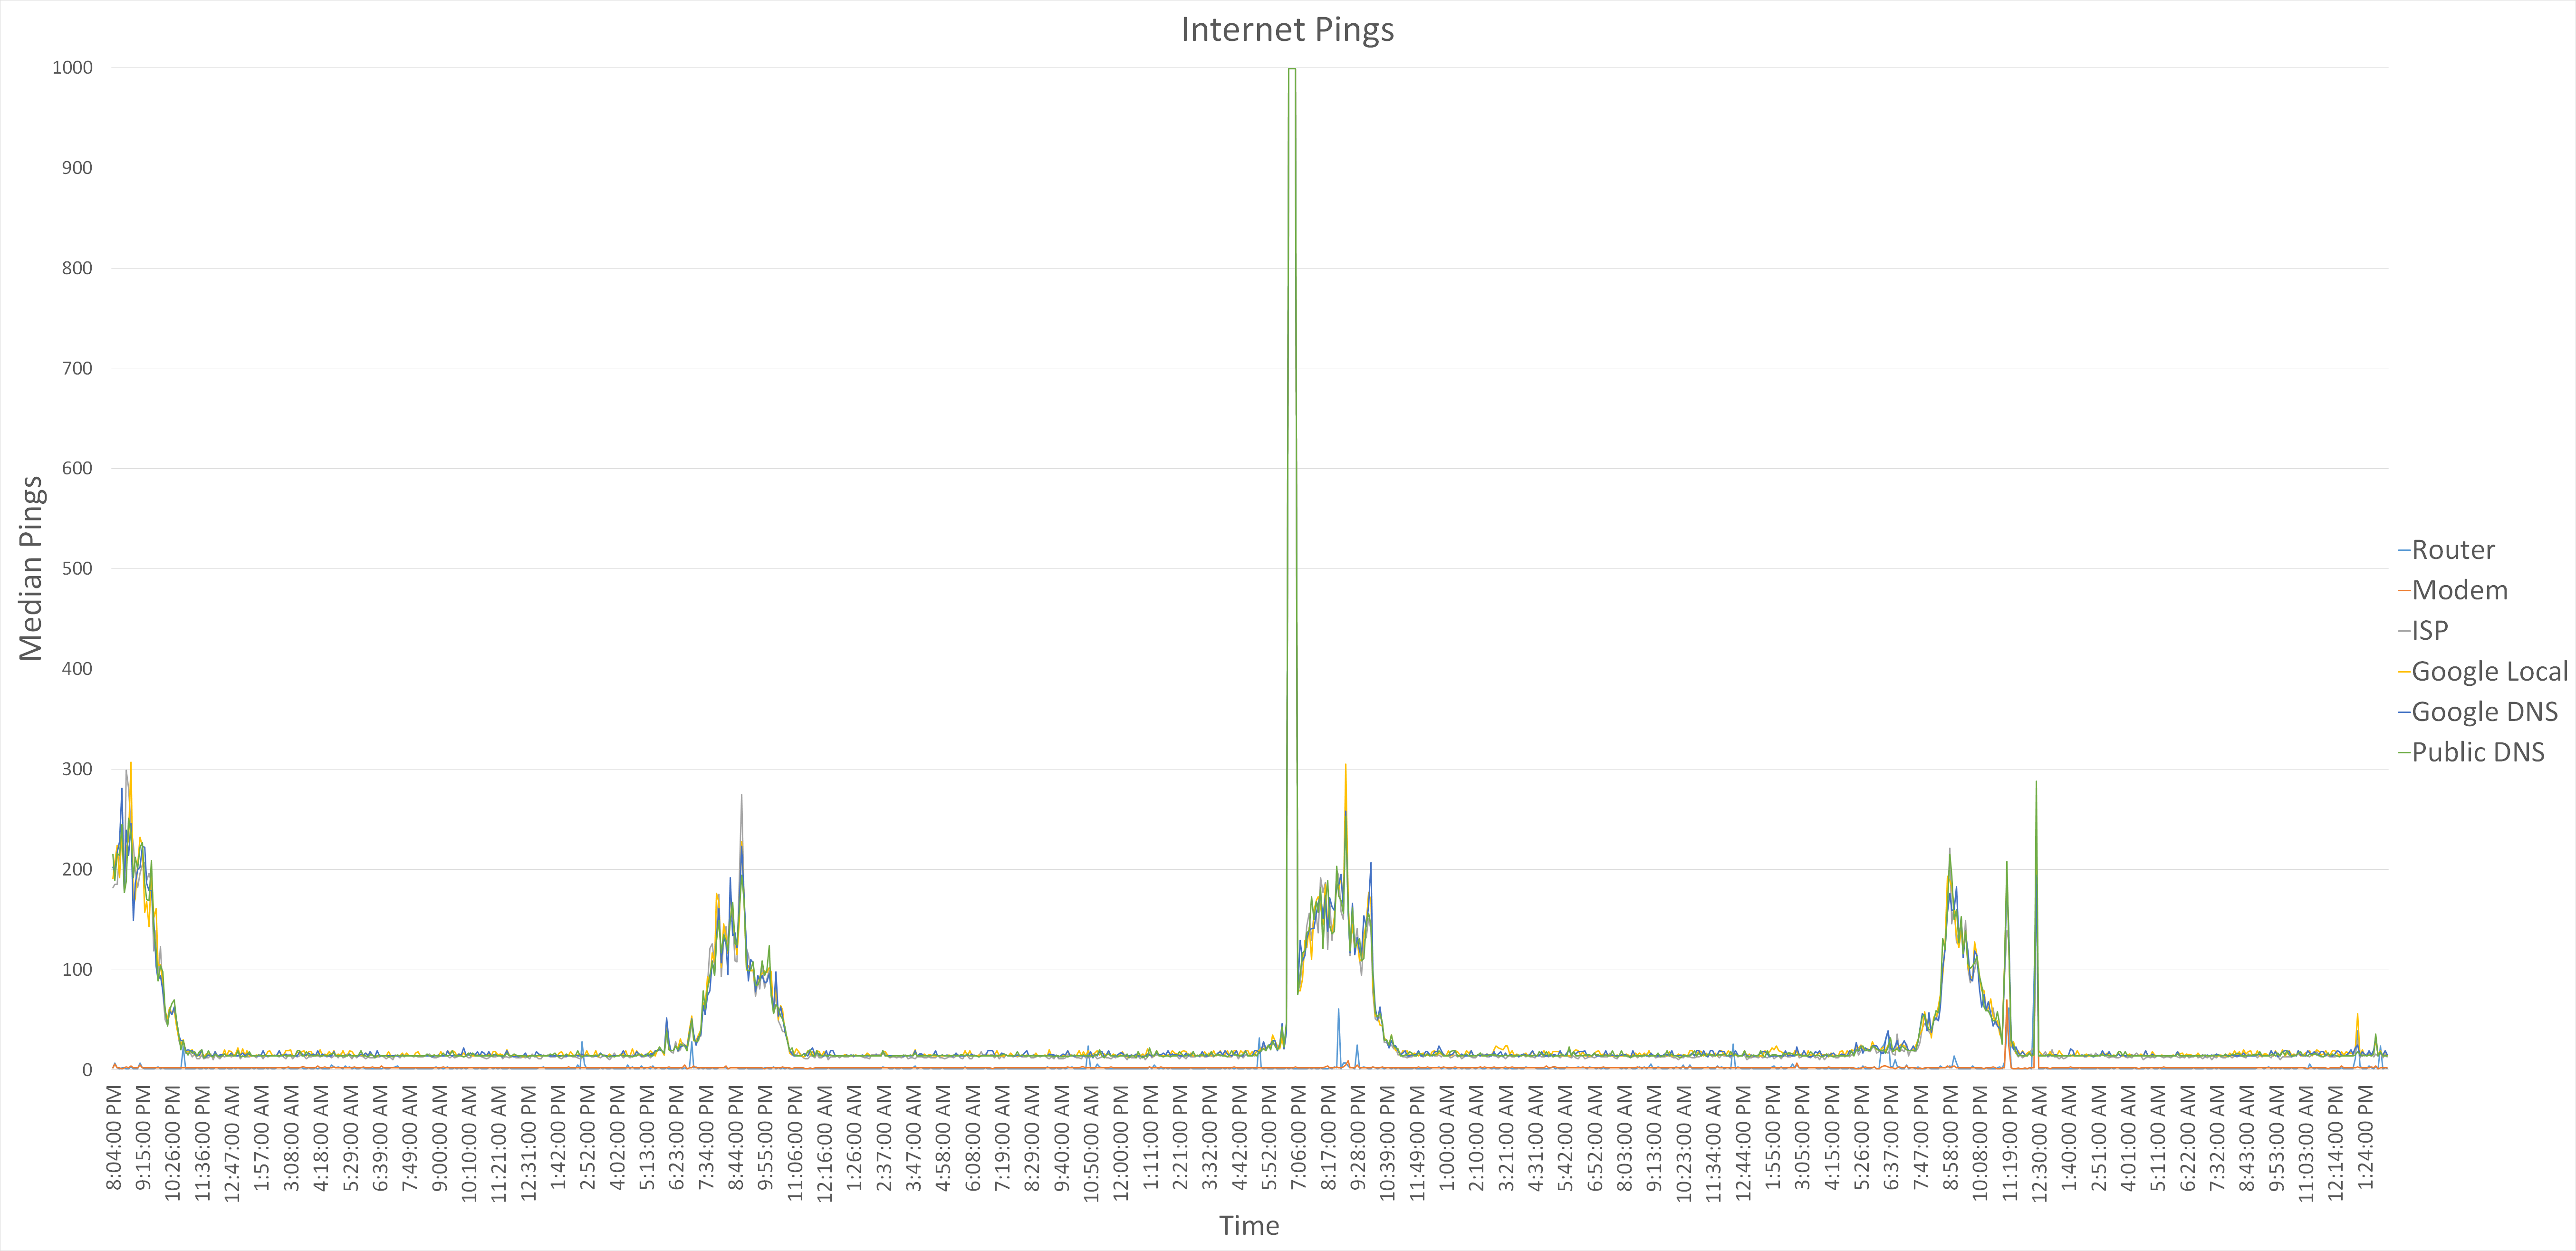
My internet’s median ping over time by /u/asecretsin. This a very simple chart, and a simple idea. What I like about it though is that it illustrates how just a little bit of logging and data visualization can reveal a pattern in one’s environment. It clearly shows that the response times slow down from 6pm to 10pm. I have a home office and it often felt like the internet slowed down around the time people starting getting off work.
From the Forum
Activity trackers without online requirement
My review of the H2O-Pal – A Hydration Tracker
Consumer genome raw data comparison – Which has the most health information?
Benefits of 24/7 heart rate monitoring
Can You Quantify Inner Peace?
How to find all major volunteer bioscience projects I can partake in?
Lastly
As someone who still is not satisfied with any sleep tracking device or app that I have tried, I related to this dialogue from a tumblr called Zen.Sen.Life:
- Sleep Tracking App: I see you’re not violently throwing yourself around your bed, you must be in a deep sleep. Sweet dreams, buddy!
- Me: I’m actually still awake.
- Sleep Tracking App: But you’re lying still…
- Me: Because I’m trying to get to sleep.
- Sleep Tracking App: You mean you ARE asleep.
- Me: I really don’t.
- Sleep Tracking App: You’re going to have to trust me, I do this professionally and I know sleep when I see it, and I’m pretty sure you’re asleep right now.
- Me: I couldn’t be more awake.
- Sleep Tracking App: This is all a dream…

