What We Are Reading
Steven Jonas
February 29, 2016
Articles
This Scientist Is Turning Every Element In the Periodic Table Into Music by Jennifer Ouellette. We have seen Randy Sargent analyze his heart rate variability with a spectogram, a tool normally used for visualizing sound. This project is perhaps the inverse, turning the molecular structure of elements into audible tones. Surprisingly, “sonification” is becoming a useful analytical tool in materials science. Here’s the sound of silicon. -Steven
Building a Better Tracker: Older Consumers Weigh In On Activity and Sleep Monitoring Devices. (PDF) This study by the Georgia Home Lab that explored the value of self-tracking for people over 50. The researchers enrolled 92 participants and set them up with seven different activity trackers, then followed them for a six week period. While participants tended to believe that self-tracking could be valuable, most of them did not learn much of interest, and reason is telling: the lessons provided by the trackers were too general. “Participants who did not find the devices to be useful said that they wanted more data related to their specific conditions and that they wanted notification if the data indicated something of concern. More sensors relevant to health conditions was the most common suggestion for improvement.” -Gary
If You Want Life Insurance, Think Twice Before Getting A Genetic Test by Christina Farr and Cops are asking Ancestry.com and 23andMe for their customers’ DNA by Kashmir Hill. I’m filing both of these stories under “Ways your data can be used against you.” -Steven
BMI Is A Terrible Measure Of Health: But we keep using it anyway by Katherine Hobson. It’s not news for me that BMI is a terrible metric. But if BMI is not a good proxy for health, what metric is out there that is better and as easy to measure? This article looks at mid-section measurements as a candidate. -Steven
Your Letters Helped Challenger Shuttle Engineer Shed 30 Years Of Guilt by Howard Berkes. This is a short piece, but it touches on themes of data-based arguments, courage, guilt, and self-forgiveness. -Steven
Show&Tell
Know Thy Cycle, Know Thyself by Ilyse Magy. Using the Fertility Awareness Method and Kindara, Ilyse diagnosed a previously unnoticed vitamin deficiency that had a huge effect on her wellbeing, as well as gained other important insights into cyclical dimensions of her health and wellbeing. ”Once I started charting, I was pretty amazed by what I was learning, but also kind of mad that no one had ever told me this stuff before.” -Gary
Why I Weighed My Whiskers by John Cousins. Inspired by an anecdote about a man’s beard growth while working on a remote island, Jon explores whether there is a relationship between his mood and facial hair. Yes, you read that right. -Steven
Stoic Self-Tracking by Alberto Frigo. One of the most consistently interesting chronicles of a self-tracking life is Morris Villarroel’s shadow of the stream, where he writes on his ongoing, multi-year life-logging projects, about which he’s given several excellent conference talks. But this week Morris turned over his blog to another deeply reflective self-tracker, the artist Alberto Frigo, whose self-tracking practice includes photographing everything he picks up in his right hand. In this post, Alberto revives an old word – operosity – in describing the worthy laboriousness of self-care. -Gary
Excerpt from Alberto’s piece:
On a bus from the Venice airport to the mountains where I am now restoring an abandoned barn to deposit my life-work, I was reading Seneca. I was reading it for different reasons; in the first place, it was what an old professor of mine quoted when he decided to give up his inspiring career and retire to a small barn near the town the bus was passing. Secondly, reading Seneca was like a counter-reaction to all the Anglo-Saxon stuff one is forced to refer to in today’s humanities. Thirdly, Seneca has often been quite superficially pointed out as one of the first persons to quantify himself.
Basis Breakdown. This an interesting take on a weekly journal, combining Basis Peak stats with daily reflections. -Steven
Data Visualizations
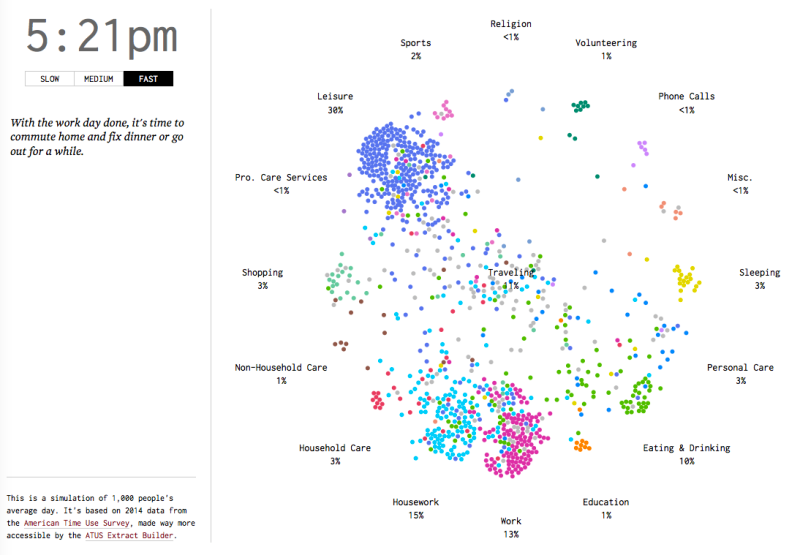
A Day in the Life of Americans by Nathan Yau. This visualization is a timelapse showing how Americans spend their day, based on the Bureau of Labor’s American Time Use Study. It would like to see a similar visualization, but for a single person with each dot representing a different date. -Steven
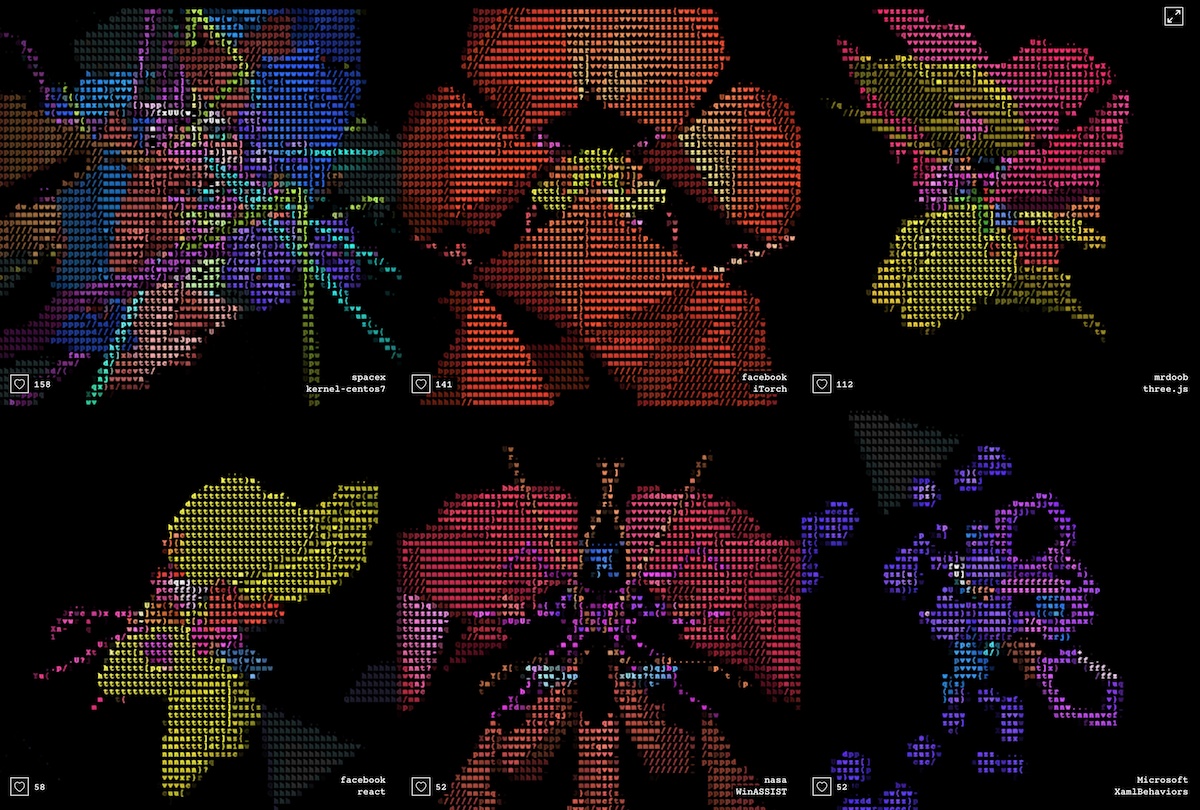
Codeology. This project takes code from github and represents them with an odd combination of 3D and ASCII text to create organic seeming shapes. After looking at a couple dozen of these, I wanted to see the shapes interact with each other. Arena fight, perhaps? -Steven
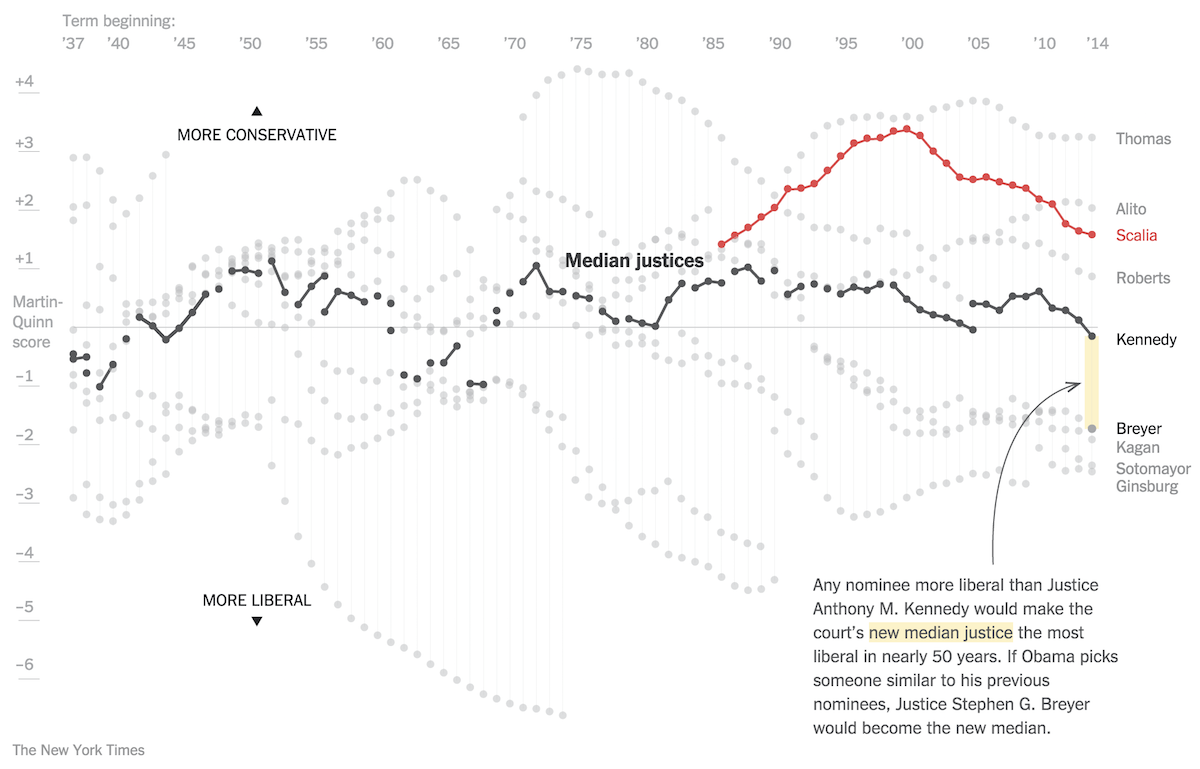
The Potential for the Most Liberal Supreme Court in Decades by Alicia Parlapiano and Margo Sanger-Katz. This excellent visualization uses Martin-Quinn scores to show the ideological leanings of Supreme Court justices’ rulings by year. More importantly, by highlighting the relative liberal or conservatism of the justice who sits in the ideological median, it shows how the character of the court has shifted through the years. -Steven


