What We Are Reading
Steven Jonas
March 4, 2017
Articles
His Doctors Were Stumped. Then He Took Over by Katie Thomas. David Fajgenbaum, a medical student, discovered that he had Castleman disease, a hard-to-classify condition that sits between cancer and immune disorder which kills a third of patients within five years of diagnosis. Like most rare diseases, he found very little about it in the literature. It’s hard to fund research for a disease that affects so few (though legislation like the Orphan Drug Act helps). Fajgenbaum was tenacious in doing his own research and was willing to experiment on himself. By keeping copious records of his condition, including the T cell and VEGF levels in his weekly blood work, he may have made a breakthrough. Again, this breakthrough may help a small number of people, but here’s the thing about rare disease: there is a lot of them. According to the article, 10 percent of the population are afflicted with one of 7,000 rare diseases. With a group that large, we need alternate methods for doing research that does not rely on large sample sizes. -Steven (Thanks to Gwern)
The Usefulness of Useless Knowledge by Abraham Flexner. Princeton University Press has just reissued this classic essay by the founder of the Institute for Advanced Study, with a new companion essay by the physicist Robbert Dijkgraaf. I’m going to buy the book, but you don’t have to do that to read the original essay, with it’s terribly relevant opening paragraph: “Is it not a curious fact that in a world steeped in irrational hatreds which threaten civilization itself, men and women – old and young – detach themselves wholly or partly from the angry current of daily life to devote themselves to the cultivation of beauty, to the extension of knowledge, to the cure of disease, to the amelioration of suffering, just as though fanatics were not simultaneously engaged in spreading pain, ugliness, and suffering?” -Gary
Total recall: the people who never forget by Linda Rodriguez McRobbie. This article looks at a small group of people with an ability called highly superior autobiographical memory. These are people who can recall, with amazing clarity, specific details from every day of their life. It’s a fascinating read, but there are two details that I want to make special mention of. One is that this doesn’t a special talent people are born with, but, rather, it was a conscious decision they made early in life. The second is that this group has certain mental habits that I recognized from my attempt to memorize days from my daybook. Unlike most people, they actively organize their memories, tying them to the calendar. For instance, they can cycle through memories to figure out their favorite Tuesday. Memories exist in relation to one another in time. Another is that they keep the memories and their relationship between one another alive through constant repetition throughout the day. This suggests to me that with spaced repetition systems, one could train themselves to have a similar ability to remember their life. -Steven
What Happens When You Mix Java with a 1960 IBM Mainframe by David Cassel – This short, amusing piece about the improvisational talent of government fix-it artists, focused on an engineer for the US Digital Service named Marianne Bellotti, describes how they manage to connect ancient databases to modern web services, using methods that will mostly remain undocumented for the protection and safety of all concerned. As Bellotti says: ““The systems that I love are really the systems that other engineers hate,” Bellotti told the audience — “the messy, archaic, half chewing gum and duct tape systems that are sort of patched together. Fortunately, I work for the federal government, so there’s really no shortage of things like that for me to play with.” -Gary
When Things Go Missing by Kathryn Schultz. There are two types of loss that I hear described by people in the Quantified Self community. The first is the loss of existing data from, say, a corrupted hard drive, or a service that folds without notifying it’s users and allowing them to download their data. The other type of loss is the missed opportunity to track something that is now in the past. Not just the steps missed by a dead fitbit, but sleep before consumer sleep trackers existed. It’s a bit odd that the same emotion is invoked by two very different situations. In this essay, Schultz explores the concept of loss, from the trivial to the life altering. It seems to be our nature to hold on to things. Life logging could be seen as a desperate pencil rubbing of experiences before they pass. As Schultz puts it, “When we are experiencing it, loss often feels like an anomaly, a disruption in the usual order of things. In fact, though, it is the usual order of things. Entropy, mortality, extinction: the entire plan of the universe consists of losing, and life amounts to a reverse savings account in which we are eventually robbed of everything. Our dreams and plans and jobs and knees and backs and memories, the childhood friend, the husband of fifty years, the father of forever, the keys to the house, the keys to the car, the keys to the kingdom, the kingdom itself: sooner or later, all of it drifts into the Valley of Lost Things.” -Steven
Design Beyond the Numbers by Elisabeth van Dijk & Wijnand IJsselsteijn. This paper from the Eindhoven University of Technology is an astute examination of the motivations of self-trackers when they share their data over social media. Despite a reputation of oversharing, most people are careful of what, how and to whom they share their personal data. We are considerate about wasting other people’s time with low-value content and look to find “true peers” for whom the information has greater relevance and less likely to be rebuked. This is an important read for any QS toolmaker for building tools that help people get more from their data by sharing it effectively. -Steven
Show & Tell
This Is What Happens to Your Body on a Thru-Hike by Kyle Boelte. Kyle was already in good shape, but then he hiked over 486 miles on the high-altitude Colorado Trail in just under a month and compared his blood work before and after. Looking at body composition, resting heart rate, blood sugar, cortisol, and testosterone, the results moved in the expected direction, but the degree of change is still astounding. One metric that was new to me is the crossover point for heart rate where fat and carbohydrates are burned equally (As one’s heart rate increases, a greater percentage of carbs is burned). Kyle’s crossover point went from 153 beats per minute to 168. As Kyle joked to his wife, “I should start a business called 8-Hour Abs. Really, just eight hours a day is all it takes!” -Steven (Thanks to Richard Sprague)
Train for Strength or Endurance? by Laila Zemraini. Laila wanted to see if she benefited more from endurance or strength-based exercises. She alternated focusing on each category and looked at the rate of progress. In finding that she responded better to strength-based exercises, she found evidence for why that would be in her 23andMe data. -Steven
Finding out more about me, for free! by Matt Macdonald-Wallace. Matt was uncomfortable with entrusting his QS data to a “corporate organisation who could potentially profit from it”. He shows how he set up his own personal data server with a dashboard by using Connector DB, which bills itself as a “open-source platform for Quantified Self and IoT.” -Steven
College Performance by Tiffany Qi. When Tiffany started college, she assiduously tracked how she spent her time in Google Calendar. Now that she’s graduated, she looks at how the way she spent her time changed over the course of four years and the impact it had on her grades.
Data Visualizations

Gerrymandering in NC, or, A Tale of Two States by Jeb Stuart. A well-employed data visualization or metric can bring a topic into sharp relief. So it is here with an analysis of gerrymandering in North Carolina. Stuart looks at the number of wasted votes in elections for North Carolina representation in the U.S. House of Representatives. What is a wasted vote? When a candidate wins, all of the votes for that candidate above 50% are considered wasted (those votes could have been used in neighboring districts if the lines were drawn differently). The resulting graph shows how extreme this effort to sequester voters really was. -Steven
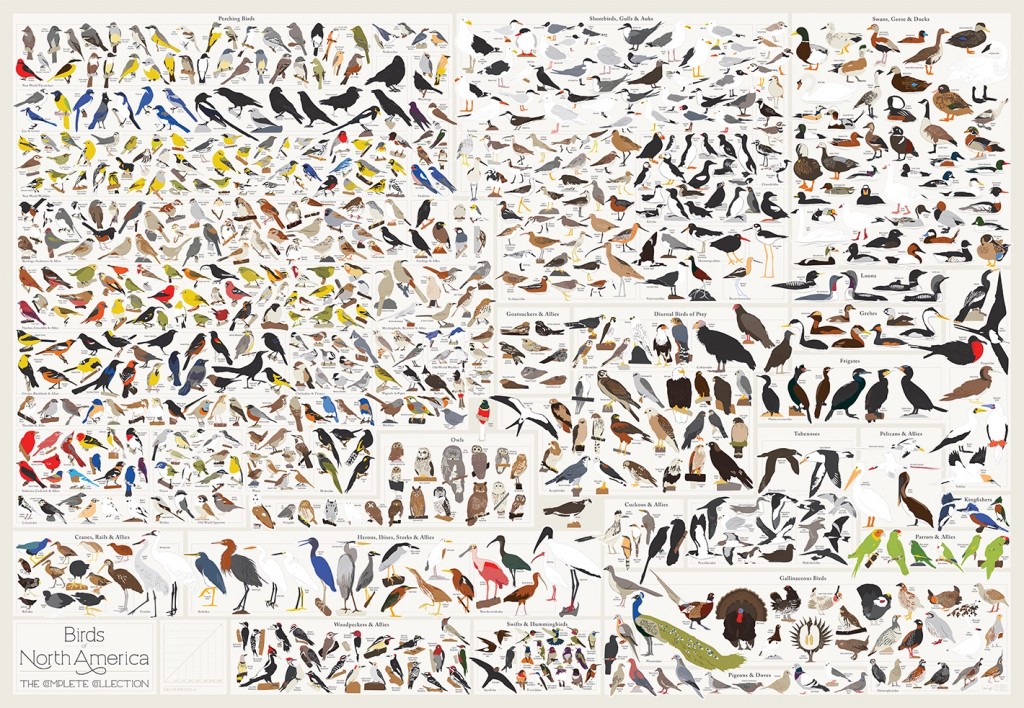
Birds of North America. This came out a couple years ago, but I just stumbled across it and spent a good ten minutes looking at all these birds. I loved looking at the variation in body and bill shapes, as well as the similarities that warranted grouping certain species together. This is a product page for a poster, but thankfully, you are able to zoom in and explore. -Steven
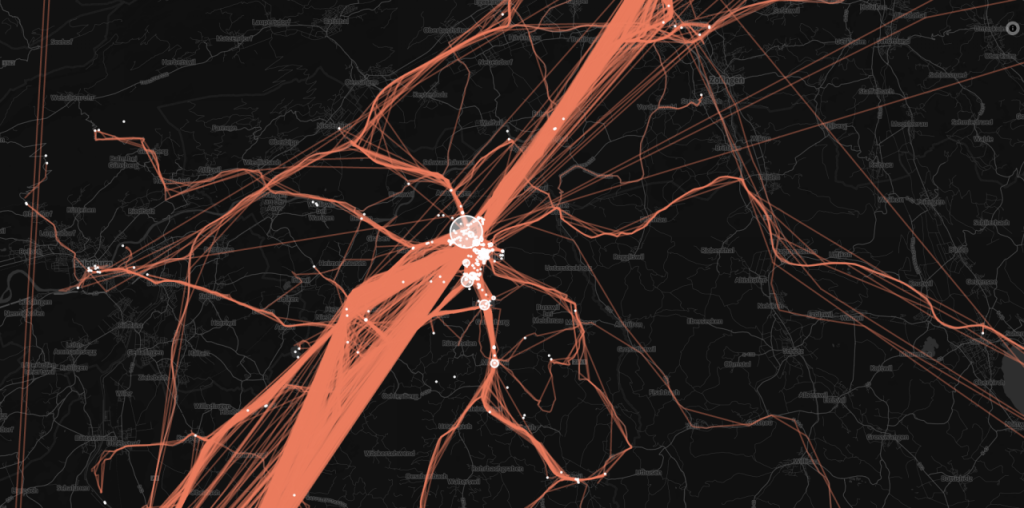
Seeing Me seeing by Simon Flühmann. I came across this visualization of a Swiss person’s Moves data on Tumblr. Unfortunately, there’s not a lot of context, but I love this type of location data visualization. -Steven
Come to QS17
Our next conference is June 17-18 in lovely Amsterdam. It’s the perfect event for seeing the latest self-experiments, debating the most interesting topics in personal data, and meeting the most fascinating people in the Quantified Self community. There are only 13 discounted tickets left. We can’t wait to see you there.
Get What We’re Reading automatically
You can subscribe to What We’re Reading and get them straight to your inbox.


