What We Are Reading
Steven Jonas
May 31, 2016
Articles
Taking 5: Work-Breaks, Productivity, and Opportunities for Personal Informatics for Knowledge Workers
By “approaching the question of break-taking objectives from a personal rather than an organizational angle” Daniel A. Epstein, Daniel Avrahami, and Jacob T. Biehl open a very interesting new set of questions to Quantified Self trackers and experimenters. The necessity of mental and physical renewal to work is well known and yet largely ignored. This paper, while preliminary and speculative, does us the service of challenging conventional wisdom about work breaks, showing that there is no simple definition for what activities count as breaks. -Gary
Why Talented Black and Hispanic Students Can Go Undiscovered by Susan Dynarski. Interesting article about how objective IQ testing of students for the gifted program in a Florida school district resulted in greater racial diversity. This contradicts the notion that IQ tests are biased against some groups and is a frightening indictment of teacher referral-based enrollment. -Steven
Social Network Algorithms Are Distorting Reality By Boosting Conspiracy Theories by Renee Diresta. In the battle to command our attention, media (and apps) have become like an evolving, antibiotic-resistant bacteria, finding new ways to manipulate our emotions and hijack our reward systems. The way information is presented by many online services preys on our biases, creating a new challenge for us as individuals to design our own experiences with the world to blunt the raw toxicity that is currently out there. But how do you do that in such a way that helps you become a better person, rather than creating your own, insulated bubble? -Steven
Who Will Debunk The Debunkers? by Daniel Engber. When a skeptic debunks a popular myth, it is usually accompanied by some story about how it actually happened, and how the myth spread. However, the same scrutiny is not often paid to this new story and is spread with the same lax attitude to veracity, as long as it comes from a solid-sounding source. As Daniel puts it, “It seems plausible that the tellers of these tales are getting blinkered by their own feelings of superiority — that the mere act of busting myths makes them more susceptible to spreading them.” -Steven
How maggots made it back into mainstream medicine by Carrie Arnold. According to the article, the use of maggots to clean wounds was gaining traction in the early 20th century. The practice was thrown out with the discovery of penicillin and the promise of a cleaner form of antibiotics. As bacteria have become more resistant to antibiotics, this “historical backwater” treatment is being looked at again. It’s assumed that patients would be put off by the “ick” factor, but the real barrier seems to be physcians. According to one nurse investigator: “Some care providers see it as ancient. ‘That’s old fashioned and ancient and we’re doing evidence-based practice’, which in their minds means new. But they’re not looking at the evidence behind larval debridement therapy, which there’s a lot of.” -Steven
How Information Graphics Reveal Your Brain’s Blind Spots by Lena Groeger. This is a great overview of the different tools that data visualizations can employ to help you understand a concept better and overcome some of your cognitive biases (or exploit them). -Steven
Show&Tell
Mimicking the Fasting Mimicking Diet by Bob Troia. This is a fantastic experiment where Bob tests for himself a caloric restriction strategy where by “cutting daily calories in half for just four days every two weeks reduced biomarkers for aging, diabetes, heart disease and cancer with no adverse effects. FMD was tested on yeast, mice, and humans and the results remained consistent among all three groups.” Bob does a great job of tracking the effect the diet has on various bio-markers, showing the results visually and sharing his data. -Steven
Crying by Robin Weis is a deeply reflective self-tracking project that explores 589 days of crying data. Robin tracked every incident of crying over about a year and half, measuring and annotating 394 cries on 216 days. There is one day with 14 cries, and the longest stretch without crying is 23 days. Robin’s report from the project has many other analytic dimensions, which she uses to anchor elements of autobiography: change in in ways she handled family stress, a long stretch of travel, and an increase in awareness of injustice linked to becoming a feminist. She uses a relatively fine grained vocabulary of emotion to categories the cries. After all, as she point out: Not all cries are made equal. Some consist of a stray melancholic tear, and some consist of unstoppable laughter. Some represent the deep, achy detachment of a piece of your identity, and some can only be onset by too much hot pepper. Whatever the provocation, as soon as any emotion or sensation crosses some intensity threshold, it seems to manifest itself by physically leaking out of one’s eyes. And if that wasn’t strange enough, the thresholds appear to be drastically different across people and stimuli. What in the actual what?
-Gary
Data Visualizations

Britain’s Diet in Data. Interesting interactive visualization that shows changes in British diets over the past 40 years. -Steven

Semantic Maps in the Brain. This is an incredible project where some researchers used an fMRI machine to map which parts of the brain showed increased activity in response to individual words while listening to the Moth Radio Hour. They then took that data and constructed a 3d-model and interactive visualization that allows you to select a spot in the brain and see which words are most likely to get a response from that area based on their predictive model. This page allows you to explore the semantic map of an individual. My understanding is that where we store information in our neocortex is individualistic. I wonder how much overlap you see across different people. -Steven
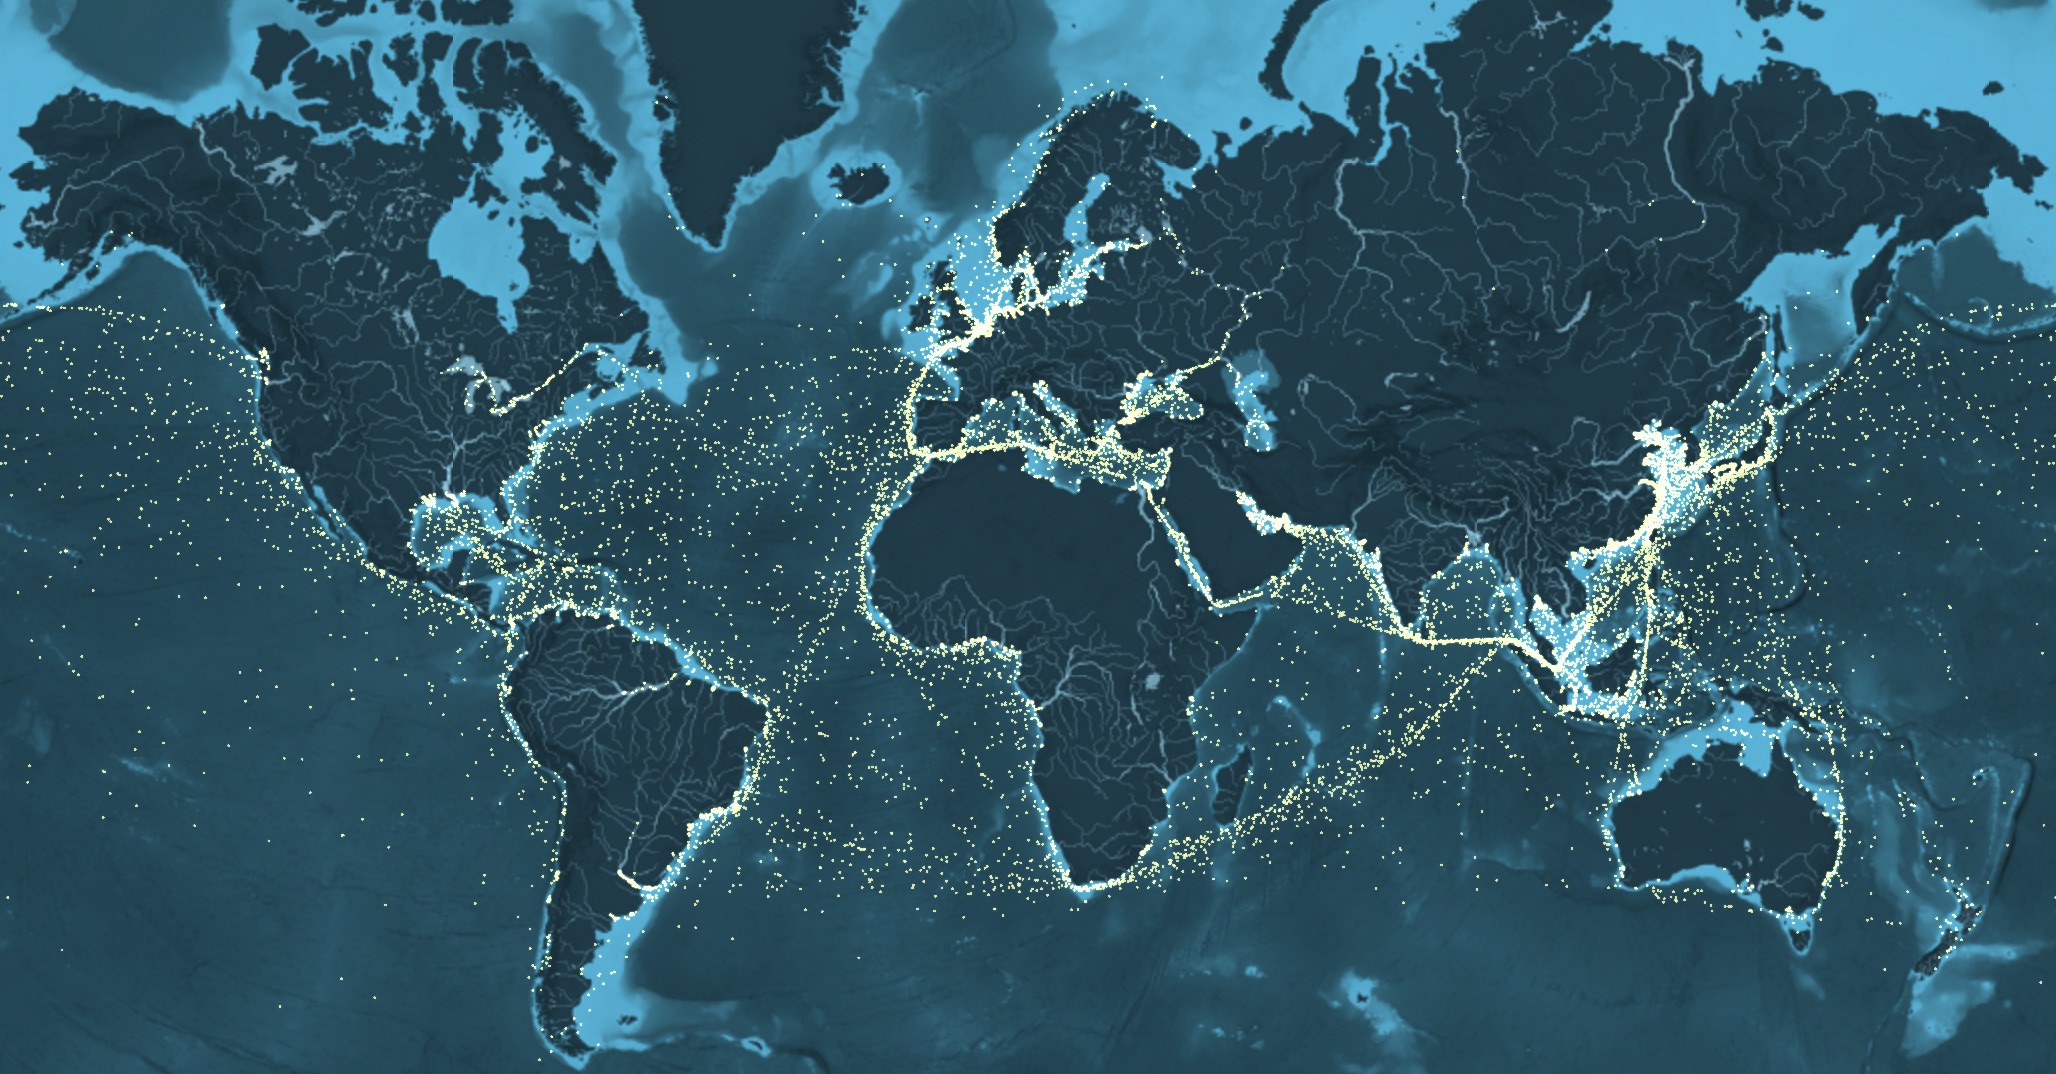
Ship Map. A beautiful interactive map of global shipping routes, but what sets it apart for me is the narration that introduces you to the visualization. Rather than show a video clip, it zooms around the interactive. -Steven

The Year that Music Died. This is a fun visualization that is a moving timeline of the top 5 songs on the Billboard charts from the past 60 years. As it moves through time, it will play a snippet of the song that was in the #1 spot at the time. For a bout of nostalgia, navigate to the years that you were in your early teens. -Steven

