What did you learn?
Allen Neuringer kicked off the conference with a talk on what he's learned from thirty years of doing and teaching self-experimentation.
Steven Jonas
March 20, 2019
In September 2018, the QS community converged in Portland for our annual conference. We are happy to share video of the talks at the event. You can find them all on the QS18 program page.
In 8 years, we have held 10 conferences. With each one, the talks show how the focus of the community continues to evolve. Some topics are continually developed, with new insights built on past projects, and other topics are new areas to be explored and shared. We see new tools, new visualizations and new techniques. Though it’s not all about what’s new. Some talks were about the excellent execution of a project using a common tool.
Our event opened with one such talk. Valerie Lanard showed how she’s tracked her fitness for over a decade simply with an excel spreadsheet that she keeps open on her computer at all times. Well, the spreadsheet started out simple. Over time, it grew in complexity to accompany many different aspects of her training. So much so that it couldn’t fit into a single talk, and focused solely on what she learned from tracking when she was NOT training. It’s a great example of what can be accomplished with a tool that’s been around for decades.
Emergent Themes
Our talks are submitted by attendees. They are a reflection of the interests of people in the community. We don’t aim to have themes with the talks, but they arise naturally. Two or three projects will be focused in the same direction, but what we find is that although the projects are seemingly similar, they turn out to be much different due to the methods, motivations, and aims of the presenters.
Novel Visualizations
One place where there was innovation was in visualization. As people in the community develop ways to understand their data and share what they learn, they are pushed to develop new ways or adopt techniques form other fields to display their data in a way that reveals more than standard visualizations. Often these changes are small, but let us see the data in a new way.
In his talk on solving his chronic headaches, Jakob Eg Larsen showed an interesting to display streaks. The visualization captures that subjective feeling of a streak feeling more significant the longer it goes on. This visualization shows the absence of something, but I could see a similar visualization being useful for habit tracking apps. Typically, an app will show the value of your current streak and perhaps the length of your highest streak, but not much more. The effect of this is that there can be a massive demotivating factor when you miss a day and that number you’ve been building up goes to 0. Here, you see the history and it conveys the feeling that you could build the streak back up again.
In a similar vein, Madison Lukacyzk developed a way to visualize her focus that showed the value and the rarity of uninterrupted time in her day. She calls it her focus meter and it quickly shows her how often and during what time of the week she is able to work without distraction.
Often when doing a self-tracking project, there is a desire for more data from more metrics. But it is often difficult to find relationships between them. Azure Grant, in her project on understanding her biological rhythms, used an effective method for displaying the coherence between 8 different metrics. In other words, which metrics tended to move in the same direction. At a glance, it’s easy to sift through 23 relationships and see where there is higher coherence. Multiply that by 4, as seen in the slide, and that’s 92 connections to quickly explore.
Running in a fasted state
A fantastic example are the talks by Jessica Ching and Mikey Sklar that involved running in a fasted state. Mikey was attempting to walk a record 100 miles in one day in a fasted state, while Jessica was finding a way around limitations imposed on people who exercise with diabetes.
While it seems obvious for Jessica to be monitoring her glucose, there were two speakers who were also tracking blood sugar but are not diabetic. Ben Best tested his response to over 30 different foods, finding that the foods that affected his blood sugar less than expeected were low-starch, high fiber breads, flax milk, strawberries and lactose-free cream cheese. Justin Lawler had many useful insights from wearing a continuous glucose monitor for four months. It showed him the clear impact that chronic stress from big life changes is having on his glucose levels. He found that simple interventions, such as taking a walk after eating blunted his blood sugar spikes. He also found that while fasting, his blood sugar dipped too low while he sleeping. Justin concluded that fasting may not be for him.
Fasting
Kyrill Potapov explored fasting further with a 5 day water fast, having panels done before and after. He found that his total cholesterol and cortisol went down sharply. His HDL was not in range, and only increased moderately during the fast. But after testing it a few weeks later, it had increased further still and was back in range. It wasn’t all good news. Some metrics moved in the wrong direction: Testosterone lowered, and triglycerides went up.
Headaches
Two projects on tracking headaches demonstrated the iterative nature of self-tracking projects. Jackob Eg Larsen and Stephen Maher both initially tried tracking the headaches themselves, but found it more difficult than it seemed. For instance, if your head hurts, but subsides for a bit, but then comes back, does that count as two headaches? Instead, they both found it easier to track not symptoms, but the interventions. For Jakob, it was when he took aspirin, and for Stephen, it was when he took triptans. The interesting thing for Jakob was that he discovered that his use of aspirin may actually be causing his headaches. Seeing the limits of the medication, it turned his new focus into not taking aspirin, and figuring out other ways to ease his headaches (hint: drink more water).
Physical Limitations
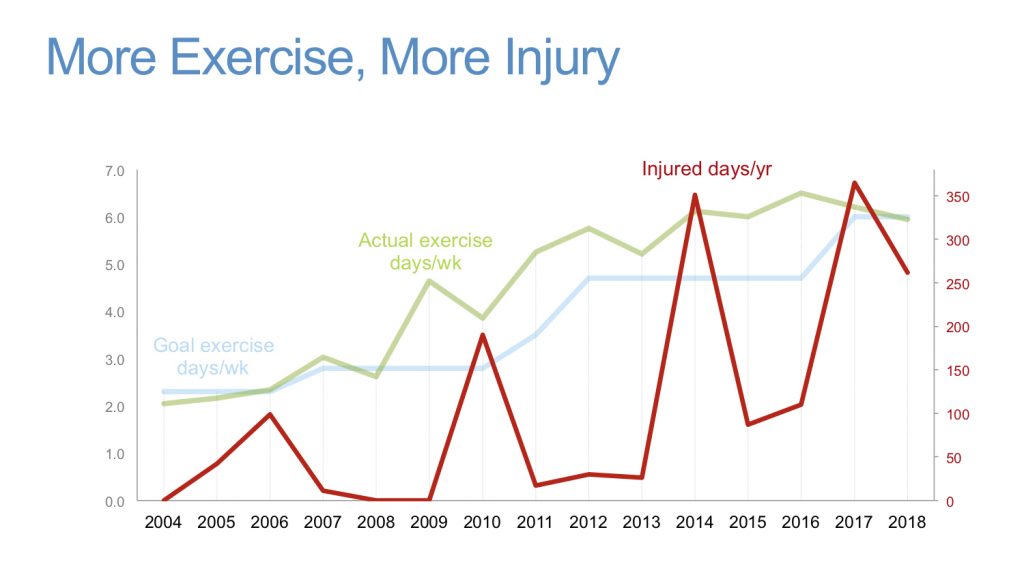
Exploring our physical limitation was a theme in Valerie Lanard and Ralph Pethica’s projects. Valerie keeps meticulous records of her workouts including what keeps her from exercising, most prominently injuries and illness. She was able to see a pattern that she most often got sick after visiting family. She also noticed that as she’s increased her goals for the amount of exercise she gets per year, her injuries also increase. This caused a few changes: She now asks her family in advance if they are sick and will postpone a visit She had a paradigm shift so that she now sees rest as a fundamental component of her training, rather than an “excuse”.
Ralph is physically active, but also works with rugby athletes to improve their fitness. This gives him insight into what kind of metrics are the most useful for predicting performance and injury. It makes sense that training too frequently without adequate rest periods is more likely to cause injury. Getting the timing right is difficult though because he found that waiting too long before training again is also more likely to cause injury. He found that subjective assessment is one of the most useful tools for seeing the stress that is being put on the body. However, as he sees with his athletes, the older ones are better (or more honest) about their self-evaluation. Perhaps it is because as we age, we start to see our limitations and must learn how to work around (or with) them.
Commitments
Daniel Reeves and Eli Ricker explored personal limitations in the form of tracking commitments. How often do we do what we say we will do and how can that be improved? Daniel Reeves found that just the tracking of commitments, caused him to make a lot fewer “I will” statements and when he does he is more specific about what he’s promising. It’s also nice to have all those commitments in one place. Eli Ricker has been exploring what affects her ability to complete her longtime goals. It took a lot of iteration to discover what motivates her. She found that the punishment works better for her than rewards for and that it was a real struggle to keep to commitments when she was on her own, rather than a structured environment.
Focus
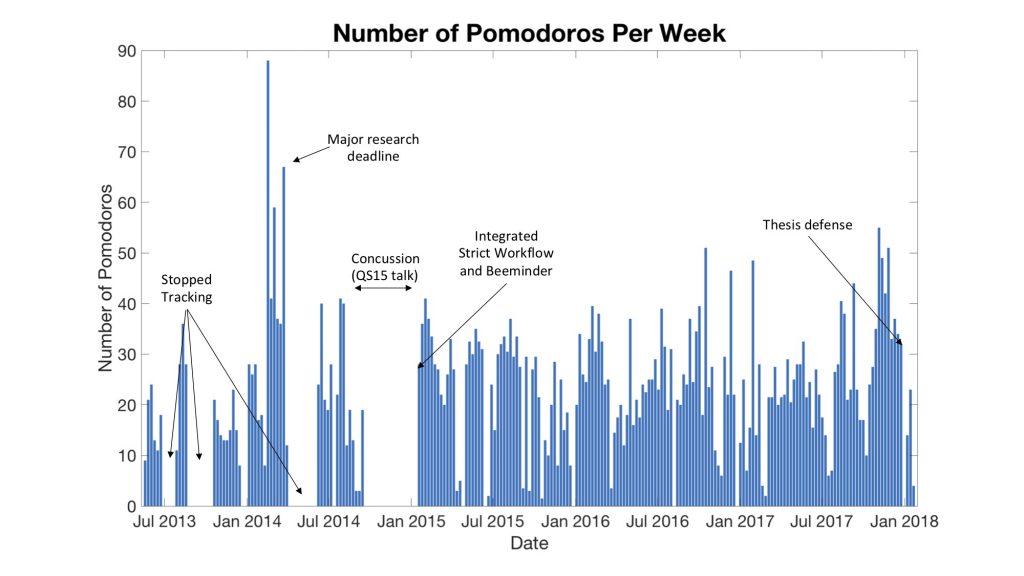
A factor in keeping commitments is focus. Maggie Delano used pomodoros, a time-blocking technique, to help keep her focus on progress towards her PhD. It took her 363 pomodoros (i.e., 25-minute blocks) to write her thesis. But she found that trying to maximize the number of pomodoros she could fit into a day wasn’t necessarily a good thing. In weeks that saw more than 40 pomodoros completed, subsequent weeks had a decreased work output. It’s an effective illustrations of minor burnout, showing Maggie the cost of overwork.
Madison Lukazyck found that looking at her time as 5-minute blocks that either did or did not have a distraction helped her visualize her week and see the days and times where she actually able to enjoy large chunks of time to get things done. Shamay Agaron used the Spire to see how effective his study sessions were, finding that he has less focus in the morning, and that study sessions over 100 minutes were increasingly ineffective.
Students
Other students that presented on their study habits included Alex Truong, who found that he spends an obscene amount of time playing Fortnite and watching YouTube (while still completing his homework, naturally) and Lydia Lutsyshyna who found that she stabilized her eating and sleeping habits by merely restricting her study to the library.
That should give a taste of the many talks that were at QS18. You can explore the entire program and download slides at the conference program page, and watch more talks at our new Show&Tell page. If you get inspired to do a project of your own, keep us in the loop by creating a project log at the forum.

