Personal Data Visualization
Steven Dean
March 15, 2011
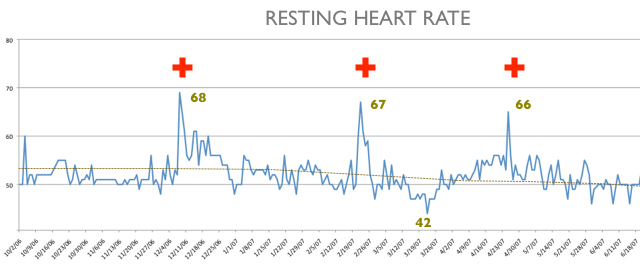
In 2007, while training for an Ironman triathlon, one of the many daily QS rituals I did included waking up in the morning and strapping on my heart rate monitor before I got out of bed to measure my resting heart rate (HR). My coach had made it one of the mandatory data points I had to capture during the 10-month training period. If my morning resting heart rate was just 2-3 beats higher than the previous days, then that most likely indicated my body was fighting an infection and I needed to pull back on my training volume no matter how good I felt. I didn’t always follow the advice and in the graph above you can see 3 times when I did not heed the advice of my coach, kept training and then within a few days I got sick (resting HR spikes). I also like seeing how, over time, my resting heart rate decreased to around 50 beats per minute and was a reflection of my improved fitness level.
In the Reflection stage of Ian Li’s stage-based model of personal informatics, he makes a distinction between reflecting in the short-term (right now) and the long-term (later on). In the morning when I read my HR, I could act upon it that day and then over time I could review the data and look for trends and patterns with my coach and modify my training as needed. Visualizing a single variable is pretty straightforward, but add multiple variables and we see how giving visual form to all this data gets tricky. What are the methods and tools that help us visualize our data so that, in turn, we can create actionable knowledge?
At our upcoming first Quantified Self Conference we have created a breakout session specifically focused on how members of the QS community are using visualization tools and methods to make meaning out of their personal data. This is going to be a hands-on session and we want you to bring your data and visualizations and share what has worked for you and the kinds of challenges you face in interpreting the data. I’ll be joined by visual artist, Laurie Frick, who has used QS data of her own and data from Ben Lipkowitz to build really beautiful analog work. Also helping out will be fellow NY QS member, Paul Marcum, who runs the New York Data Visualization and Infographics meetup.
Laurie offers a few thoughts on the breakout session:
Composition in art and composition for data visualization are close relations. I’m betting that the same things that make a painting or even an installation work, are the same things that pull the chaos out of data visualization.
1. Everything tells a story – the visual image carries the weight, can we still understand the context without labels or words?
2. What’s first, second, third – where do you want me to start and where does my eye go next, and next. How long can you hold me?
3. Mondrian was right – you can achieve balance without symmetry. Color, line, size, shape carry weight….your eye can feel balance.
4. The brain wants organization ….but only to a point, then it wants a little surprise.
If you are coming to the conference and interested in the Data Visualization breakout session, let us know about your favorite methods, tools and tricks by starting a dialogue in the comments section on this post. This will help us shape the breakout session for our QS community. Below are a bunch of QS and other resources that may help inspire us.
Highlights from QS Show&Tells with a focus on data viz
(I haven’t watched all 135 so feel free to add others.)
- Mimi Chun’s food color charts
- Nicholas Felton and Ryan Case’s talk on Daytum
- Steven Lehrburger’s Foursquare heat maps
- Ted Power’s Geo-Tracking project
- Dave Miller’s cycling power meter data
- Gordon Bell’s MyLifeBits project generates 1 GB of data per month. How to visualize that?
- Robert Carlsen’s talk on riding through mountains of cycling data.
QS Blog Contributors On Visualization
- Personal Data Visualization Contest Sep 2008
- Visualization Inspiration Sep 2009
- The Visualization Zoo May 2010
- Patterns Nov 2010
Data Visualization Tools, Resources & Inspiration

